Estimated Value: $344,000 - $427,000
4
Beds
3
Baths
2,990
Sq Ft
$128/Sq Ft
Est. Value
About This Home
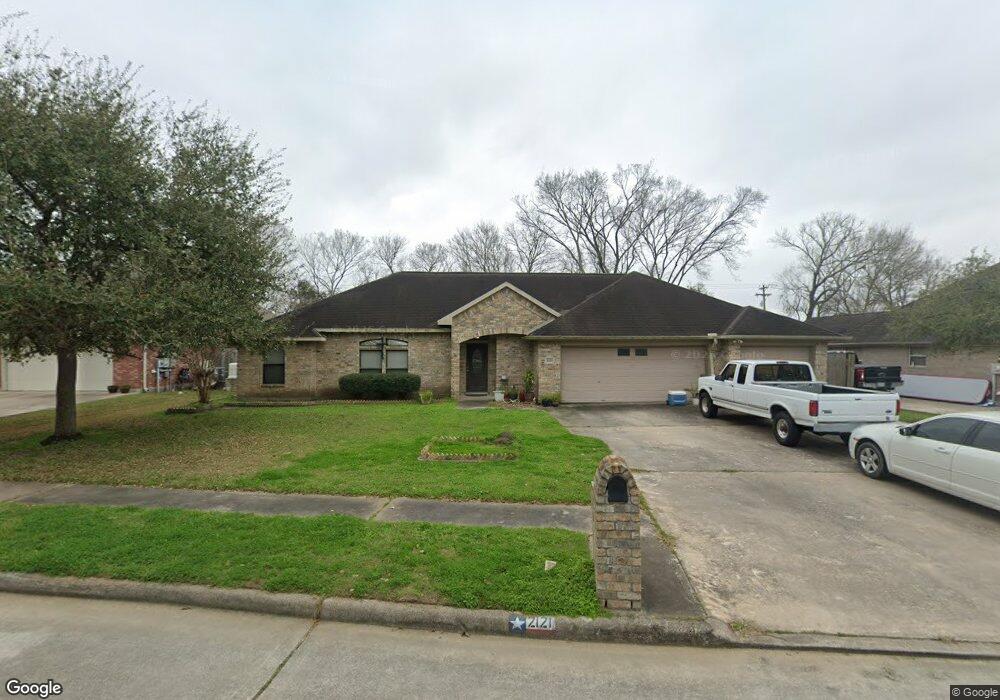
This home is located at 2121 Troon Dr, Alvin, TX 77511 and is currently estimated at $383,120, approximately $128 per square foot. 2121 Troon Dr is a home located in Brazoria County with nearby schools including Alvin Elementary School, Alvin Junior High School, and Alvin High School.
Ownership History
Date
Name
Owned For
Owner Type
Purchase Details
Closed on
Jul 27, 2016
Sold by
Hayslip Claudia Williams
Bought by
Edwards Eric L and Edwards Carrie S
Current Estimated Value
Home Financials for this Owner
Home Financials are based on the most recent Mortgage that was taken out on this home.
Original Mortgage
$245,373
Outstanding Balance
$201,205
Interest Rate
4.37%
Mortgage Type
FHA
Estimated Equity
$181,915
Purchase Details
Closed on
Apr 1, 2005
Sold by
Buenrostro Ernesto and Buenrostro Erika
Bought by
Hayslip Claudia
Home Financials for this Owner
Home Financials are based on the most recent Mortgage that was taken out on this home.
Original Mortgage
$38,000
Interest Rate
5.75%
Mortgage Type
Seller Take Back
Purchase Details
Closed on
Nov 30, 2001
Sold by
Hayslip John V and Hayslip Claudia
Bought by
Williams Claude Smith and Williams Janis Parker
Purchase Details
Closed on
Jan 26, 2001
Sold by
C & H Alvin Joint Venture Ltd
Bought by
Hayslip John
Create a Home Valuation Report for This Property
The Home Valuation Report is an in-depth analysis detailing your home's value as well as a comparison with similar homes in the area
Home Values in the Area
Average Home Value in this Area
Purchase History
| Date | Buyer | Sale Price | Title Company |
|---|---|---|---|
| Edwards Eric L | -- | Stewart Title | |
| Hayslip Claudia | -- | Alamo Title Company | |
| Williams Claude Smith | -- | -- | |
| Hayslip John | -- | Lawyers Title |
Source: Public Records
Mortgage History
| Date | Status | Borrower | Loan Amount |
|---|---|---|---|
| Open | Edwards Eric L | $245,373 | |
| Previous Owner | Hayslip Claudia | $38,000 |
Source: Public Records
Tax History Compared to Growth
Tax History
| Year | Tax Paid | Tax Assessment Tax Assessment Total Assessment is a certain percentage of the fair market value that is determined by local assessors to be the total taxable value of land and additions on the property. | Land | Improvement |
|---|---|---|---|---|
| 2025 | $9,784 | $380,450 | $51,280 | $329,170 |
| 2023 | $9,784 | $405,320 | $51,280 | $354,040 |
| 2022 | $9,119 | $332,440 | $47,860 | $284,580 |
| 2021 | $8,350 | $289,220 | $49,220 | $240,000 |
| 2020 | $7,797 | $266,410 | $41,020 | $225,390 |
| 2019 | $7,906 | $263,210 | $34,180 | $229,030 |
| 2018 | $7,528 | $250,170 | $34,180 | $215,990 |
| 2017 | $7,700 | $252,700 | $34,180 | $218,520 |
| 2016 | $7,614 | $255,180 | $34,180 | $221,000 |
| 2015 | $2,001 | $227,160 | $34,180 | $192,980 |
| 2014 | $2,001 | $222,320 | $34,180 | $188,140 |
Source: Public Records
Map
Nearby Homes
- 2408 Chelmsford Ct
- 1237 Lancer Leap Dr
- 1217 Lancer Leap Dr
- 1229 Steed Bluff Dr
- 1215 Colt Canyon Dr
- 1203 Lancer Leap Dr
- 2306 Westfield St
- 221 Magnolia Laurel Dr
- 239 Bay Laurel Ct
- 211 Orchard Laurel Dr
- 220 Magnolia Laurel Dr
- 204 Orchard Laurel Dr
- 243 Bay Laurel Ct
- 230 Magnolia Laurel Dr
- 1916 Tracy Lynn Ln
- 1211 Quarterhorse Dr
- 1201 Stallion Ridge
- 1193 Stallion Ridge
- 1279 Pinto Pass
- 1600 Rosharon Rd Unit 19