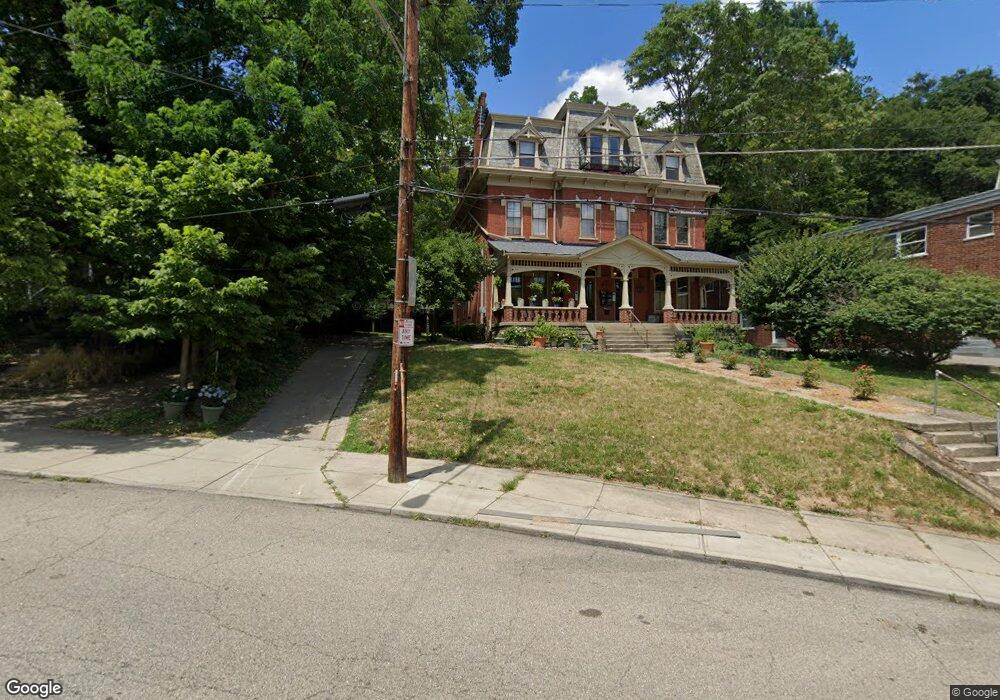
2122 Kemper Ln Cincinnati, OH 45206
Walnut Hills NeighborhoodEstimated Value: $171,000 - $186,000
1
Bed
1
Bath
805
Sq Ft
$220/Sq Ft
Est. Value
About This Home
This home is located at 2122 Kemper Ln, Cincinnati, OH 45206 and is currently estimated at $177,111, approximately $220 per square foot. 2122 Kemper Ln is a home located in Hamilton County with nearby schools including Frederick Douglass Elementary School, Robert A. Taft Information Technology High School, and Clark Montessori High School.
Ownership History
Date
Name
Owned For
Owner Type
Purchase Details
Closed on
May 13, 2004
Sold by
Moore Nancy
Bought by
Millard Stephanie G
Current Estimated Value
Purchase Details
Closed on
Mar 25, 2004
Sold by
Butler David and Kidder Steman Esther
Bought by
Moore Nancy
Purchase Details
Closed on
Feb 19, 1997
Sold by
Reed Sean M
Bought by
Moore Michael R
Home Financials for this Owner
Home Financials are based on the most recent Mortgage that was taken out on this home.
Original Mortgage
$51,300
Interest Rate
7.95%
Purchase Details
Closed on
Jul 31, 1996
Sold by
Seitz Sharon L
Bought by
Reed Sean M
Home Financials for this Owner
Home Financials are based on the most recent Mortgage that was taken out on this home.
Original Mortgage
$39,200
Interest Rate
8.33%
Create a Home Valuation Report for This Property
The Home Valuation Report is an in-depth analysis detailing your home's value as well as a comparison with similar homes in the area
Home Values in the Area
Average Home Value in this Area
Purchase History
| Date | Buyer | Sale Price | Title Company |
|---|---|---|---|
| Millard Stephanie G | -- | -- | |
| Moore Nancy | -- | -- | |
| Moore Michael R | $54,000 | -- | |
| Reed Sean M | $49,000 | -- |
Source: Public Records
Mortgage History
| Date | Status | Borrower | Loan Amount |
|---|---|---|---|
| Previous Owner | Moore Michael R | $51,300 | |
| Previous Owner | Reed Sean M | $39,200 |
Source: Public Records
Tax History Compared to Growth
Tax History
| Year | Tax Paid | Tax Assessment Tax Assessment Total Assessment is a certain percentage of the fair market value that is determined by local assessors to be the total taxable value of land and additions on the property. | Land | Improvement |
|---|---|---|---|---|
| 2024 | $2,515 | $42,067 | $6,930 | $35,137 |
| 2023 | $2,570 | $42,067 | $6,930 | $35,137 |
| 2022 | $2,006 | $29,442 | $6,930 | $22,512 |
| 2021 | $1,932 | $29,442 | $6,930 | $22,512 |
| 2020 | $1,987 | $29,442 | $6,930 | $22,512 |
| 2019 | $1,979 | $26,765 | $6,300 | $20,465 |
| 2018 | $1,982 | $26,765 | $6,300 | $20,465 |
| 2017 | $1,884 | $26,765 | $6,300 | $20,465 |
| 2016 | $1,650 | $23,094 | $3,504 | $19,590 |
| 2015 | $1,487 | $23,094 | $3,504 | $19,590 |
| 2014 | $1,498 | $23,094 | $3,504 | $19,590 |
| 2013 | $1,674 | $25,375 | $3,850 | $21,525 |
Source: Public Records
Map
Nearby Homes
- 2106 Kemper Ln
- 2191 Victory Pkwy
- 2195 Victory Pkwy
- 2199 Victory Pkwy
- 967 Windsor St
- 2019 Calvin Cliff St Unit 10
- 965 Windsor St
- 2210 Victory Pkwy
- 2334 Kemper Ln
- 2232 Fulton Ave
- 2110 Fulton Ave
- 2114 Fulton Ave
- 2100 Fulton Ave
- 2324 Park Ave
- 911 Rogers Place
- 2356 Park Ave
- 2356 Park Ave Unit 44
- 2100 Sinton Ave
- 2122 Kemper Ln
- 2122 Kemper Ln
- 2122 Kemper Ln Unit 5
- 2120 Kemper Ln
- 2120 Kemper Ln Unit 1 & 2
- 2120 Kemper Ln Unit 2
- 2116 Kemper Ln Unit 6
- 2116 Kemper Ln Unit 4
- 2116 Kemper Ln
- 2116 Kemper Ln Unit 10
- 2116 Kemper Ln Unit 9
- 2116 Kemper Ln
- 2116 Kemper Ln Unit 12
- 2200 Kemper Ln
- 2118 Kemper Ln
- 2112 Kemper Ln
- 2112 Kemper Ln
- 2112 Kemper Ln
- 2112 Kemper Ln Unit 3
- 2112 Kemper Ln Unit 1