2122 Nicholson Carr Rd Chester, GA 31012
Estimated Value: $75,000 - $175,000
Studio
1
Bath
1,440
Sq Ft
$84/Sq Ft
Est. Value
About This Home
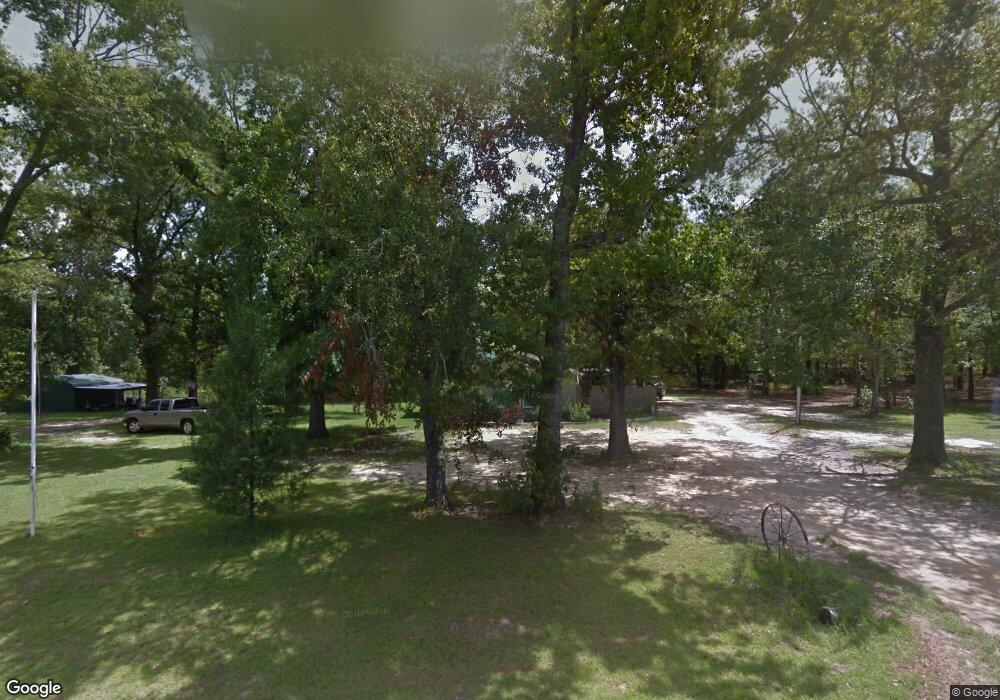
This home is located at 2122 Nicholson Carr Rd, Chester, GA 31012 and is currently estimated at $120,682, approximately $83 per square foot. 2122 Nicholson Carr Rd is a home with nearby schools including Dodge County High School.
Ownership History
Date
Name
Owned For
Owner Type
Purchase Details
Closed on
Sep 30, 2024
Sold by
Moore Brad
Bought by
Knight Tamela Anne
Current Estimated Value
Purchase Details
Closed on
May 18, 2008
Sold by
Moore Kevin
Bought by
Moore Henry E
Home Financials for this Owner
Home Financials are based on the most recent Mortgage that was taken out on this home.
Original Mortgage
$31,026
Interest Rate
5.82%
Mortgage Type
New Conventional
Purchase Details
Closed on
May 16, 2008
Sold by
Moore Talbert Ed
Bought by
Moore Henry E
Home Financials for this Owner
Home Financials are based on the most recent Mortgage that was taken out on this home.
Original Mortgage
$31,026
Interest Rate
5.82%
Mortgage Type
New Conventional
Purchase Details
Closed on
Apr 24, 2008
Sold by
Dixon Adam S
Bought by
Moore Eddie
Home Financials for this Owner
Home Financials are based on the most recent Mortgage that was taken out on this home.
Original Mortgage
$31,026
Interest Rate
5.82%
Mortgage Type
New Conventional
Purchase Details
Closed on
Jun 21, 1996
Bought by
Dixon Adam S
Create a Home Valuation Report for This Property
The Home Valuation Report is an in-depth analysis detailing your home's value as well as a comparison with similar homes in the area
Home Values in the Area
Average Home Value in this Area
Purchase History
| Date | Buyer | Sale Price | Title Company |
|---|---|---|---|
| Knight Tamela Anne | $70,000 | -- | |
| Moore Brad | -- | -- | |
| Moore Henry E | -- | -- | |
| Moore Henry E | -- | -- | |
| Moore Eddie | $16,000 | -- | |
| Dixon Adam S | $1,500 | -- |
Source: Public Records
Mortgage History
| Date | Status | Borrower | Loan Amount |
|---|---|---|---|
| Previous Owner | Moore Eddie | $31,026 |
Source: Public Records
Tax History
| Year | Tax Paid | Tax Assessment Tax Assessment Total Assessment is a certain percentage of the fair market value that is determined by local assessors to be the total taxable value of land and additions on the property. | Land | Improvement |
|---|---|---|---|---|
| 2025 | $948 | $38,282 | $1,900 | $36,382 |
| 2024 | $540 | $28,003 | $1,900 | $26,103 |
| 2023 | $723 | $28,003 | $1,900 | $26,103 |
| 2022 | $688 | $26,730 | $1,449 | $25,281 |
| 2021 | $681 | $26,385 | $1,449 | $24,936 |
| 2020 | $686 | $26,178 | $1,242 | $24,936 |
| 2019 | $641 | $24,164 | $1,242 | $22,922 |
| 2018 | $652 | $25,495 | $1,242 | $24,253 |
| 2017 | $635 | $24,856 | $1,242 | $23,614 |
| 2016 | $648 | $25,357 | $1,242 | $24,115 |
| 2015 | -- | $25,356 | $1,242 | $24,115 |
| 2014 | -- | $25,858 | $1,242 | $24,616 |
| 2013 | -- | $25,857 | $1,241 | $24,616 |
Source: Public Records
Map
Nearby Homes
- 205 Smith Sapp Rd
- 0 Cheek Rd
- 0 Nobles Rd Unit 10683117
- 639 Jones Rd
- 762 Nicholson Carr Rd
- 0 Allen Ranch Rd
- 733 Chester Unit Cochran Highway
- 0 Chester - Cochran Hwy
- 319 Country Club Rd
- 500 Bowman Rd
- 733 Chester - Cochran Hwy
- 0 Rock Hill Rd
- 0 Georgia 257
- 0 Pebble Hills Rd Unit 10714124
- 0 Pebble Hills Rd Unit 7738211
- 166 Pebble Hills Rd
- 176 Pineland Estates Rd
- 0 Churchwell Rd Unit 255785
- 0 Churchwell Rd Unit 24917742
- 492 Ga Highway 26 E
- 2372 Nicholson Carr Rd
- 2308 Nicholson Carr Rd
- 2171 Nicholson Carr Rd
- 2075 Nicholson Carr Rd
- 1359 Macedonia Church Rd
- 1303 Macedonia Church Rd
- 1304 Macedonia Church Rd
- 221 Nicholson Carr Rd
- 1436 Macedonia Church Rd
- 1253 Macedonia Church Rd
- 2659 W Chicken Rd
- 214 Nicholson Carr Rd
- 1230 Macedonia Church Rd
- 173 Dodge-Macedonia Church Rd
- 0 Macedonia Church Rd
- 0 Macedonia Church Rd
- 240 Nicholson Carr Rd
- 1177 Macedonia Church Rd
- 173 Macedonia Church Rd
- 199 Nicholson Carr Rd
Your Personal Tour Guide
Ask me questions while you tour the home.