2122 Riverbirch Ct SW Unit 1 Lawrenceville, GA 30044
Estimated Value: $399,201 - $406,000
4
Beds
3
Baths
2,258
Sq Ft
$179/Sq Ft
Est. Value
About This Home
This home is located at 2122 Riverbirch Ct SW Unit 1, Lawrenceville, GA 30044 and is currently estimated at $403,550, approximately $178 per square foot. 2122 Riverbirch Ct SW Unit 1 is a home located in Gwinnett County with nearby schools including Cedar Hill Elementary School, Richards Middle School, and Discovery High School.
Ownership History
Date
Name
Owned For
Owner Type
Purchase Details
Closed on
May 21, 2019
Sold by
Autry W Gary
Bought by
Burkette Tenesha Mignon
Current Estimated Value
Home Financials for this Owner
Home Financials are based on the most recent Mortgage that was taken out on this home.
Original Mortgage
$218,960
Outstanding Balance
$193,166
Interest Rate
4.37%
Mortgage Type
FHA
Estimated Equity
$210,384
Purchase Details
Closed on
Sep 24, 2001
Sold by
Sunland Investments Inc
Bought by
Autry Autry W and Autry Staci
Home Financials for this Owner
Home Financials are based on the most recent Mortgage that was taken out on this home.
Original Mortgage
$163,706
Interest Rate
6.67%
Mortgage Type
FHA
Purchase Details
Closed on
May 31, 1996
Sold by
Jenkins D G Dev Corp
Bought by
Stevens Wayne Janet D
Create a Home Valuation Report for This Property
The Home Valuation Report is an in-depth analysis detailing your home's value as well as a comparison with similar homes in the area
Home Values in the Area
Average Home Value in this Area
Purchase History
| Date | Buyer | Sale Price | Title Company |
|---|---|---|---|
| Burkette Tenesha Mignon | $223,000 | -- | |
| Autry Autry W | $165,000 | -- | |
| Sundland Investment Inc | $8,300 | -- | |
| Stevens Wayne Janet D | $152,000 | -- |
Source: Public Records
Mortgage History
| Date | Status | Borrower | Loan Amount |
|---|---|---|---|
| Open | Burkette Tenesha Mignon | $218,960 | |
| Previous Owner | Sundland Investment Inc | $163,706 | |
| Closed | Stevens Wayne Janet D | $0 |
Source: Public Records
Tax History Compared to Growth
Tax History
| Year | Tax Paid | Tax Assessment Tax Assessment Total Assessment is a certain percentage of the fair market value that is determined by local assessors to be the total taxable value of land and additions on the property. | Land | Improvement |
|---|---|---|---|---|
| 2024 | $5,330 | $140,200 | $24,000 | $116,200 |
| 2023 | $5,330 | $146,800 | $32,000 | $114,800 |
| 2022 | $4,565 | $119,800 | $26,400 | $93,400 |
| 2021 | $3,659 | $92,880 | $19,200 | $73,680 |
| 2020 | $3,546 | $89,200 | $19,200 | $70,000 |
| 2019 | $946 | $81,160 | $19,200 | $61,960 |
| 2018 | $928 | $81,160 | $19,200 | $61,960 |
| 2016 | $924 | $58,680 | $12,000 | $46,680 |
| 2015 | $943 | $58,680 | $12,000 | $46,680 |
| 2014 | $951 | $58,680 | $12,000 | $46,680 |
Source: Public Records
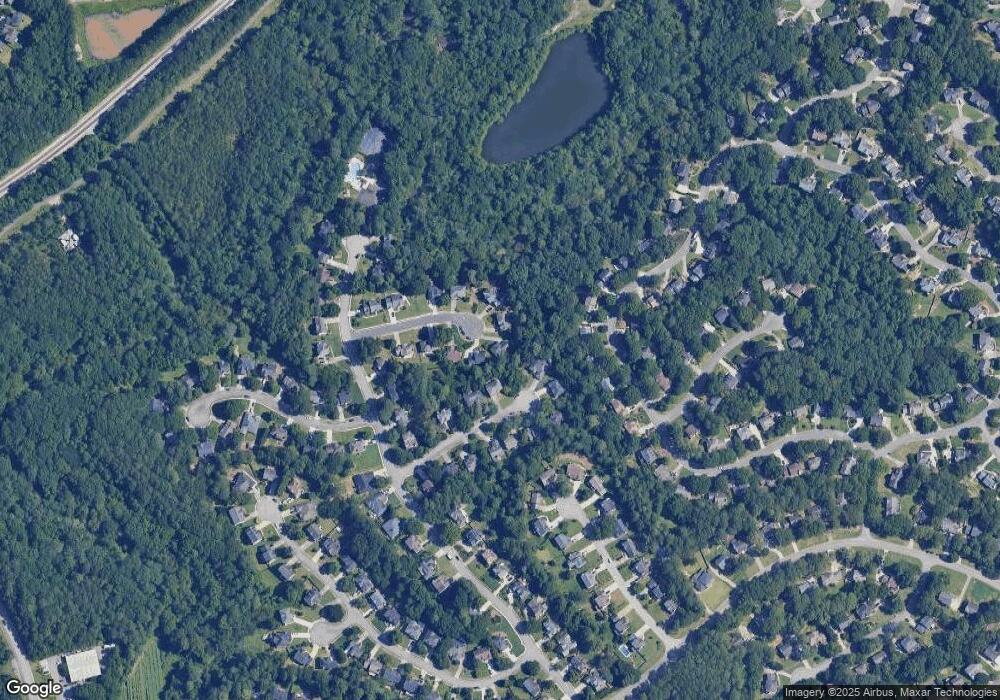
Map
Nearby Homes
- 421 Congress Pkwy
- 305 Melanie Way
- 2150 Plantation Rd
- 301 Congress Pkwy
- 193 Patterson Close Ct
- 411 Hunters Glen Ct
- 280 Hayward Ln Unit 1
- 1941 Travers Cir
- 2220 Laurelton Ln Unit 1
- 1995 Plantation Rd
- 450 Battersea Dr
- 2081 Hunters Ridge Dr Unit 4
- 490 Hunters Glen Ct Unit 2
- 280 Kentshire Place
- 26 Burns View Ct
- 1849 Forkview Dr
- 2493 Barndale Dr
- 1805 Skidmore Cir
- 1902 Patterson Park Dr
- 2122 Riverbirch Ct SW Unit 73
- 2122 Riverbirch Ct SW
- 2127 Riverbirch Ct Unit 1
- 2132 Riverbirch Ct
- 2125 Sweetbirch Trail
- 2115 Sweetbirch Trail Unit 1
- 2142 Riverbirch Ct
- 2137 Riverbirch Ct
- 2135 Sweetbirch Trail Unit 2135
- 2135 Sweetbirch Trail
- 2152 Riverbirch Ct
- 2100 Sweetbirch Trail Unit 1
- 2147 Riverbirch Ct
- 521 Congress Pkwy
- 531 Congress Pkwy Unit 3
- 2155 Sweetbirch Trail
- 0 Riverbirch Ct SW Unit 8591624
- 0 Riverbirch Ct SW Unit 8871811
- 0 Riverbirch Ct SW Unit 8808029
- 0 Riverbirch Ct SW Unit 3160008