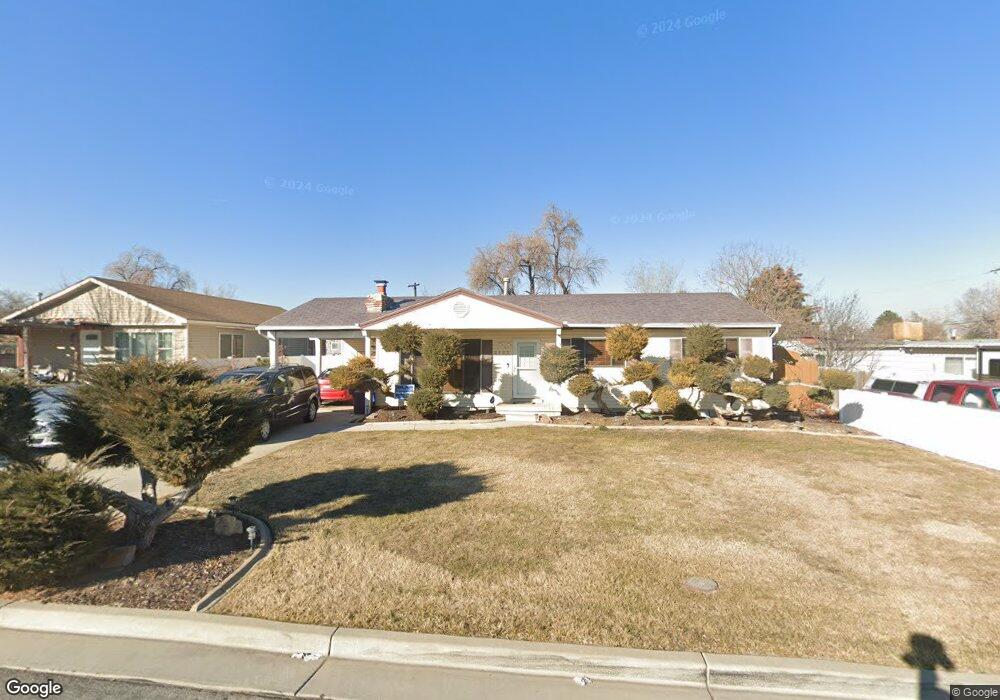
2122 Westfield Cir West Jordan, UT 84084
Estimated Value: $395,000 - $473,000
3
Beds
1
Bath
1,056
Sq Ft
$418/Sq Ft
Est. Value
About This Home
This home is located at 2122 Westfield Cir, West Jordan, UT 84084 and is currently estimated at $441,931, approximately $418 per square foot. 2122 Westfield Cir is a home located in Salt Lake County with nearby schools including Majestic Elementary Arts Academy, West Jordan Middle School, and West Jordan High School.
Ownership History
Date
Name
Owned For
Owner Type
Purchase Details
Closed on
May 10, 2010
Sold by
Jones William E and Jones Patricia K
Bought by
Jones William E and Jones Patricia K
Current Estimated Value
Home Financials for this Owner
Home Financials are based on the most recent Mortgage that was taken out on this home.
Original Mortgage
$110,000
Outstanding Balance
$73,693
Interest Rate
5.04%
Mortgage Type
New Conventional
Estimated Equity
$368,239
Purchase Details
Closed on
Jun 5, 2002
Sold by
Jones William E and Jones Patricia K
Bought by
Jones William E and Jones Patricia K
Purchase Details
Closed on
Oct 17, 1995
Sold by
Jones William E and Jones Patricia K
Bought by
Jones William E and Jones Patricia K
Home Financials for this Owner
Home Financials are based on the most recent Mortgage that was taken out on this home.
Original Mortgage
$65,000
Interest Rate
7.67%
Create a Home Valuation Report for This Property
The Home Valuation Report is an in-depth analysis detailing your home's value as well as a comparison with similar homes in the area
Home Values in the Area
Average Home Value in this Area
Purchase History
| Date | Buyer | Sale Price | Title Company |
|---|---|---|---|
| Jones William E | -- | Accommodation | |
| Jones William E | -- | Backman Title Services | |
| Jones William E | -- | -- | |
| Jones William E | -- | -- |
Source: Public Records
Mortgage History
| Date | Status | Borrower | Loan Amount |
|---|---|---|---|
| Open | Jones William E | $110,000 | |
| Closed | Jones William E | $65,000 |
Source: Public Records
Tax History Compared to Growth
Tax History
| Year | Tax Paid | Tax Assessment Tax Assessment Total Assessment is a certain percentage of the fair market value that is determined by local assessors to be the total taxable value of land and additions on the property. | Land | Improvement |
|---|---|---|---|---|
| 2025 | $1,889 | $370,000 | $144,000 | $226,000 |
| 2024 | $1,889 | $363,400 | $132,600 | $230,800 |
| 2023 | $1,887 | $342,100 | $127,500 | $214,600 |
| 2022 | $1,968 | $351,100 | $125,000 | $226,100 |
| 2021 | $1,719 | $279,100 | $96,000 | $183,100 |
| 2020 | $1,620 | $246,900 | $83,000 | $163,900 |
| 2019 | $1,560 | $233,200 | $83,000 | $150,200 |
| 2018 | $1,426 | $211,400 | $79,400 | $132,000 |
| 2017 | $1,319 | $194,600 | $79,400 | $115,200 |
| 2016 | $1,287 | $178,500 | $79,400 | $99,100 |
| 2015 | $1,241 | $167,800 | $84,700 | $83,100 |
| 2014 | $1,111 | $147,900 | $75,600 | $72,300 |
Source: Public Records
Map
Nearby Homes
- 2062 W 7705 S
- 2169 W 7600 S
- 7645 S 1960 W
- 2386 W 7680 S
- 1829 W 7600 S Unit G301
- 1817 W 7600 S Unit I204
- 1801 W 7600 S Unit C201
- 7647 S 2500 W
- 1805 W 7600 S Unit D204
- 8026 Laguna Cir
- 7693 S Redwood Rd
- 2510 W Jordan Meadows Ln
- 8140 S 2245 W
- 2497 Bueno Vista Dr
- 2573 Jordan Meadows Ln
- 1678 Leland Dr
- 1790 W Sugar Factory Rd
- 7657 Sunrise Place E
- 7700 S 1530 W Unit 4
- 7279 S Kenadi Ct
- 2130 Westfield Cir
- 2114 Westfield Cir
- 2095 W Rhinehurst Cir
- 2095 Rhinehurst Cir
- 2108 Westfield Cir
- 2099 Rhinehurst Cir
- 2081 Rhinehurst Cir
- 2146 Westfield Cir
- 2123 Westfield Cir
- 2131 Westfield Cir
- 2115 Westfield Cir
- 2096 Westfield Cir
- 2073 Rhinehurst Cir
- 2073 W 7705 S
- 2139 Westfield Cir
- 2086 Westfield Cir
- 2154 Westfield Cir
- 2098 Rhinehurst Cir
- 2107 Westfield Cir
- 2147 Westfield Cir