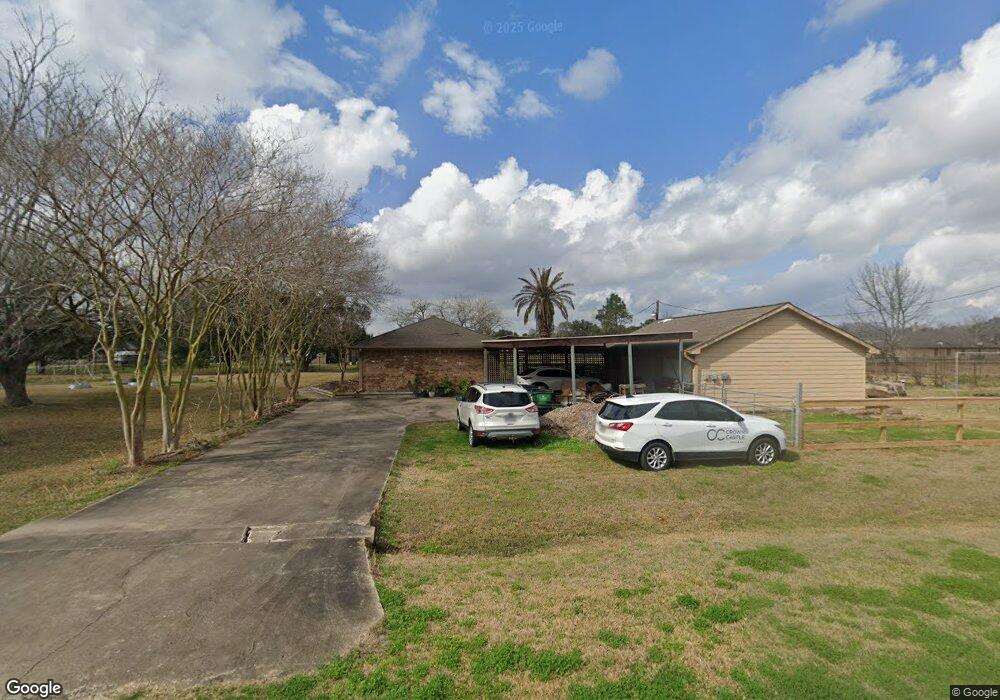
21221 Horse Shoe Dr Manvel, TX 77578
Estimated Value: $361,000 - $502,000
--
Bed
2
Baths
1,604
Sq Ft
$263/Sq Ft
Est. Value
About This Home
This home is located at 21221 Horse Shoe Dr, Manvel, TX 77578 and is currently estimated at $421,078, approximately $262 per square foot. 21221 Horse Shoe Dr is a home located in Brazoria County with nearby schools including E.C. Mason Elementary School and Manvel High School.
Ownership History
Date
Name
Owned For
Owner Type
Purchase Details
Closed on
Dec 21, 2000
Sold by
Wilson David R
Bought by
Grabowski Stephen G
Current Estimated Value
Home Financials for this Owner
Home Financials are based on the most recent Mortgage that was taken out on this home.
Original Mortgage
$105,900
Outstanding Balance
$39,250
Interest Rate
7.78%
Estimated Equity
$381,828
Purchase Details
Closed on
Nov 29, 1995
Sold by
Wilson Rebecca Ann
Bought by
Wilson David Ray
Home Financials for this Owner
Home Financials are based on the most recent Mortgage that was taken out on this home.
Original Mortgage
$16,800
Interest Rate
7.36%
Mortgage Type
Seller Take Back
Purchase Details
Closed on
Jul 12, 1994
Sold by
Carpenter Melvin R and Carpenter Billie
Bought by
Wilson David R and Wilson Rebecca A
Home Financials for this Owner
Home Financials are based on the most recent Mortgage that was taken out on this home.
Original Mortgage
$16,800
Interest Rate
8.52%
Create a Home Valuation Report for This Property
The Home Valuation Report is an in-depth analysis detailing your home's value as well as a comparison with similar homes in the area
Home Values in the Area
Average Home Value in this Area
Purchase History
| Date | Buyer | Sale Price | Title Company |
|---|---|---|---|
| Grabowski Stephen G | -- | -- | |
| Wilson David Ray | -- | -- | |
| Wilson David R | -- | -- | |
| Wilson David R | -- | -- |
Source: Public Records
Mortgage History
| Date | Status | Borrower | Loan Amount |
|---|---|---|---|
| Open | Grabowski Stephen G | $105,900 | |
| Previous Owner | Wilson David Ray | $16,800 | |
| Previous Owner | Wilson David R | $16,800 | |
| Closed | Wilson David R | $0 |
Source: Public Records
Tax History Compared to Growth
Tax History
| Year | Tax Paid | Tax Assessment Tax Assessment Total Assessment is a certain percentage of the fair market value that is determined by local assessors to be the total taxable value of land and additions on the property. | Land | Improvement |
|---|---|---|---|---|
| 2025 | $4,460 | $272,867 | $120,780 | $192,000 |
| 2023 | $4,460 | $225,510 | $181,170 | $158,320 |
| 2022 | $5,533 | $204,864 | $103,940 | $124,350 |
| 2021 | $5,269 | $186,240 | $77,210 | $109,030 |
| 2020 | $4,965 | $186,240 | $77,210 | $109,030 |
| 2019 | $4,695 | $156,250 | $54,450 | $101,800 |
| 2018 | $5,001 | $172,980 | $56,920 | $116,060 |
| 2017 | $4,961 | $169,940 | $59,400 | $110,540 |
| 2016 | $4,584 | $167,810 | $50,000 | $117,810 |
| 2015 | $3,566 | $142,770 | $37,030 | $105,740 |
| 2014 | $3,566 | $134,180 | $37,030 | $97,150 |
Source: Public Records
Map
Nearby Homes
- 21214 Creek Rd
- 21219 Horse Shoe Dr
- 7315 Pine St
- 9108 Quail Ridge Dr
- 21103 Highway 6
- 1 Wolfe Ln
- 5035 Prairie Gourd Meadow
- 5102 Pomegranate Path
- TBD County Rd 95 Mustang Bayou Rd
- 8428 Bissell Rd
- 807 Starduster
- 20503 Morris Ave
- 6655 Cemetery Rd
- 101 Ridge Rd
- 142 Taxi Way Nine
- 141 Taxi Way Nine
- 135 Taxi Way Nine
- 138 Taxi Way Nine
- 137 Taxi Way Nine
- 0 Lewis Ln
- 21225 Horse Shoe Dr
- 21226 Horse Shoe Dr
- 21220 Creek Rd
- 21218 Horse Shoe Dr
- 21226 Creek Rd
- 21226 Creek Rd
- 21210 Horse Shoe Dr
- 21208 Creek Rd
- 21306 Crossfield Rd
- 7101 Pine Ln
- 21202 Creek Rd
- 21219 Creek Rd
- 21225 Creek Rd
- 21229 Creek Rd
- 7102 Pine Ln
- 7102 Pine St
- 7030 Pine Ln
- 7020 Pine Ln
- 21130 Creek Rd
- 7205 Pine Ln