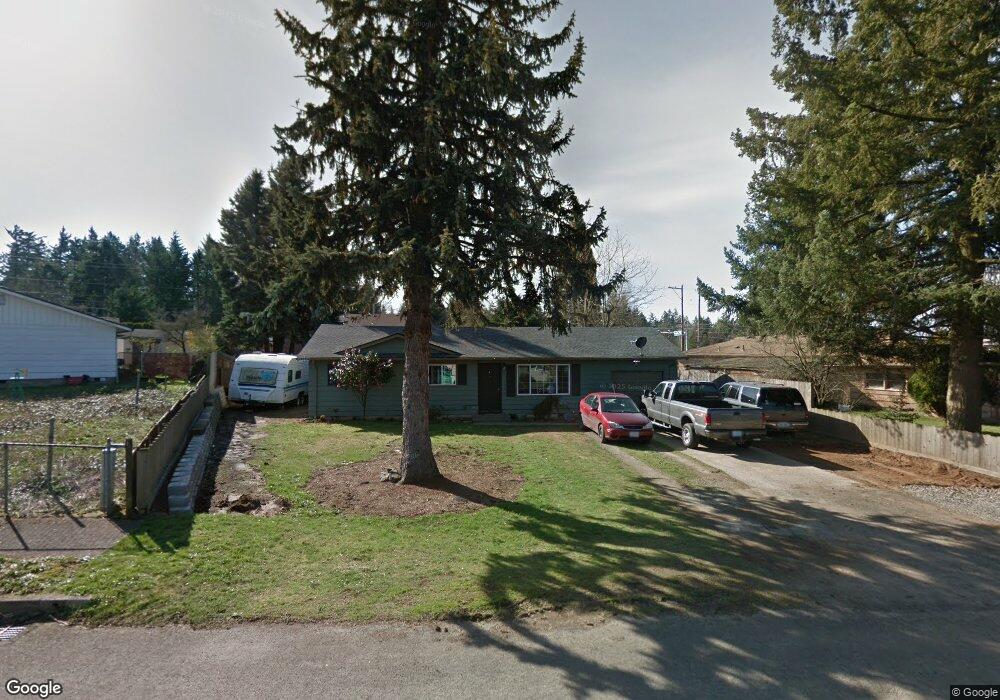
21226 SE Main St Gresham, OR 97030
North Central NeighborhoodEstimated Value: $389,000 - $416,000
3
Beds
1
Bath
1,040
Sq Ft
$384/Sq Ft
Est. Value
About This Home
This home is located at 21226 SE Main St, Gresham, OR 97030 and is currently estimated at $399,376, approximately $384 per square foot. 21226 SE Main St is a home located in Multnomah County with nearby schools including North Gresham Elementary School, Clear Creek Middle School, and Gresham High School.
Ownership History
Date
Name
Owned For
Owner Type
Purchase Details
Closed on
May 11, 2015
Sold by
Hardesty Larry T
Bought by
Dominguez Jose Odilon Marquez
Current Estimated Value
Home Financials for this Owner
Home Financials are based on the most recent Mortgage that was taken out on this home.
Original Mortgage
$190,486
Outstanding Balance
$146,265
Interest Rate
3.67%
Mortgage Type
FHA
Estimated Equity
$253,111
Purchase Details
Closed on
Feb 8, 2008
Sold by
Hardesty Larry T
Bought by
Hardesty Larry T and Hardesty Julie E
Home Financials for this Owner
Home Financials are based on the most recent Mortgage that was taken out on this home.
Original Mortgage
$170,000
Interest Rate
5.85%
Mortgage Type
Purchase Money Mortgage
Purchase Details
Closed on
Oct 21, 2005
Sold by
Phillips Esther Eleanor
Bought by
Hardesty Larry T
Home Financials for this Owner
Home Financials are based on the most recent Mortgage that was taken out on this home.
Original Mortgage
$135,000
Interest Rate
8.15%
Mortgage Type
Balloon
Create a Home Valuation Report for This Property
The Home Valuation Report is an in-depth analysis detailing your home's value as well as a comparison with similar homes in the area
Home Values in the Area
Average Home Value in this Area
Purchase History
| Date | Buyer | Sale Price | Title Company |
|---|---|---|---|
| Dominguez Jose Odilon Marquez | $194,000 | Fidelity National Title | |
| Hardesty Larry T | -- | Accommodation | |
| Hardesty Larry T | $215,000 | Lawyers Title Ins | |
| Hardesty Larry T | $150,000 | Fidelity Natl Title Co Of Or |
Source: Public Records
Mortgage History
| Date | Status | Borrower | Loan Amount |
|---|---|---|---|
| Open | Dominguez Jose Odilon Marquez | $190,486 | |
| Previous Owner | Hardesty Larry T | $170,000 | |
| Previous Owner | Hardesty Larry T | $135,000 |
Source: Public Records
Tax History
| Year | Tax Paid | Tax Assessment Tax Assessment Total Assessment is a certain percentage of the fair market value that is determined by local assessors to be the total taxable value of land and additions on the property. | Land | Improvement |
|---|---|---|---|---|
| 2025 | $3,499 | $171,930 | -- | -- |
| 2024 | $3,349 | $166,930 | -- | -- |
| 2023 | $3,051 | $162,070 | $0 | $0 |
| 2022 | $2,966 | $157,350 | $0 | $0 |
| 2021 | $2,891 | $152,770 | $0 | $0 |
| 2020 | $2,721 | $148,330 | $0 | $0 |
| 2019 | $2,649 | $144,010 | $0 | $0 |
| 2018 | $2,526 | $139,820 | $0 | $0 |
| 2017 | $2,424 | $135,750 | $0 | $0 |
| 2016 | $2,137 | $131,800 | $0 | $0 |
Source: Public Records
Map
Nearby Homes
- 21033 SE Clay Ct
- 2013 NW Bella Vista Dr
- 1811 NW 19th St
- 21532 SE Alder St
- 21016 SE Stark St Unit 71
- 21016 SE Stark St Unit 69
- 21260 SE Stark St
- 21400 SE Stark St Unit 2
- 1861 NW Wonderview Ave
- 1596 NW Riverview Ave
- 21525 SE Oak St
- 209 SE 214th Ave
- 132 SE 214th Ave
- 21553 SE Ankeny Terrace
- 210 SE 218th Ave
- 1035 SE 225th Ave
- 1387 NW Riverview Ave Unit 14B
- 1325 NW 9th St
- 70 NW Birdsdale Ave
- 54 NW 13th St
- 1302 SE 212th Ave
- 21322 SE Main St
- 1310 SE 212th Ave
- 1223 NW Burnside Rd
- 1263 SE 212th - Withdrawn
- 21321 SE Main St
- 21328 SE Main St
- 1249 SE 214th Ave
- 21225 SE Main St
- 1214 SE 212th Ave
- 1323 SE 212th Ave
- 1255 SE 212th Ave
- 21334 SE Main St
- 1233 SE 213th Ave
- 1250 SE 214th Ave
- 1207 SE 213th Ave
- 1241 SE 212th Ave
- 1239 SE 213th Ave
- 1150 SE 212th Ave
- 21346 SE Main St
Your Personal Tour Guide
Ask me questions while you tour the home.