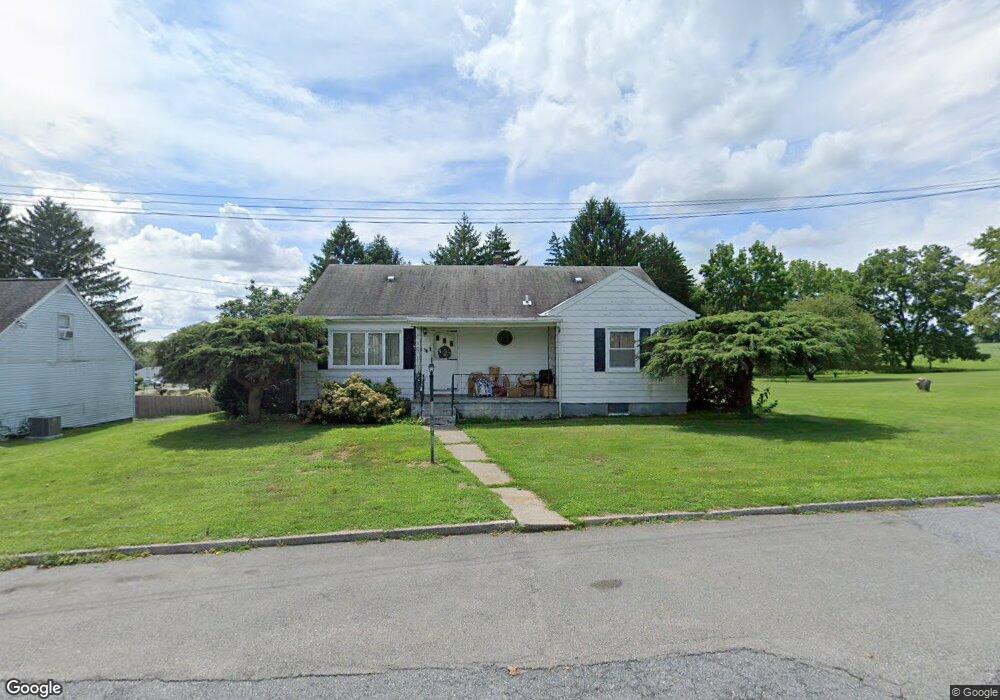
2123 11th St Bethlehem, PA 18020
Middletown NeighborhoodEstimated Value: $312,000 - $353,000
3
Beds
2
Baths
1,106
Sq Ft
$300/Sq Ft
Est. Value
About This Home
This home is located at 2123 11th St, Bethlehem, PA 18020 and is currently estimated at $332,093, approximately $300 per square foot. 2123 11th St is a home located in Northampton County with nearby schools including East Hills Middle School, Freedom High School, and Bethlehem Christian School.
Ownership History
Date
Name
Owned For
Owner Type
Purchase Details
Closed on
Nov 10, 2006
Sold by
Talarico Mark
Bought by
Hill Donald W
Current Estimated Value
Home Financials for this Owner
Home Financials are based on the most recent Mortgage that was taken out on this home.
Original Mortgage
$229,189
Outstanding Balance
$136,480
Interest Rate
6.33%
Mortgage Type
FHA
Estimated Equity
$195,613
Purchase Details
Closed on
Aug 8, 2002
Bought by
Talarico Mark and Talarico Marianne
Create a Home Valuation Report for This Property
The Home Valuation Report is an in-depth analysis detailing your home's value as well as a comparison with similar homes in the area
Home Values in the Area
Average Home Value in this Area
Purchase History
| Date | Buyer | Sale Price | Title Company |
|---|---|---|---|
| Hill Donald W | $231,000 | -- | |
| Talarico Mark | $164,500 | -- |
Source: Public Records
Mortgage History
| Date | Status | Borrower | Loan Amount |
|---|---|---|---|
| Open | Hill Donald W | $229,189 |
Source: Public Records
Tax History Compared to Growth
Tax History
| Year | Tax Paid | Tax Assessment Tax Assessment Total Assessment is a certain percentage of the fair market value that is determined by local assessors to be the total taxable value of land and additions on the property. | Land | Improvement |
|---|---|---|---|---|
| 2025 | $578 | $53,500 | $18,800 | $34,700 |
| 2024 | $4,106 | $53,500 | $18,800 | $34,700 |
| 2023 | $4,119 | $53,500 | $18,800 | $34,700 |
| 2022 | $4,082 | $53,500 | $18,800 | $34,700 |
| 2021 | $4,050 | $53,500 | $18,800 | $34,700 |
| 2020 | $4,055 | $53,500 | $18,800 | $34,700 |
| 2019 | $4,040 | $53,500 | $18,800 | $34,700 |
| 2018 | $3,929 | $53,500 | $18,800 | $34,700 |
| 2017 | $3,902 | $53,500 | $18,800 | $34,700 |
| 2016 | -- | $53,500 | $18,800 | $34,700 |
| 2015 | -- | $53,500 | $18,800 | $34,700 |
| 2014 | -- | $53,500 | $18,800 | $34,700 |
Source: Public Records
Map
Nearby Homes