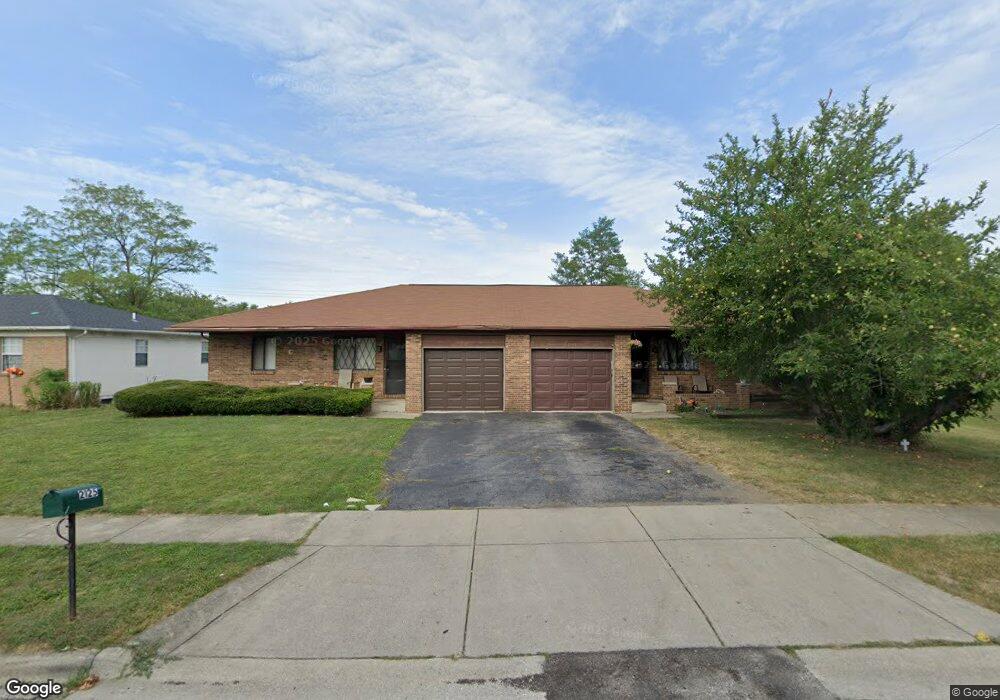
2123-2125 Hughey Dr Reynoldsburg, OH 43068
Estimated Value: $298,000 - $334,000
4
Beds
2
Baths
2,016
Sq Ft
$154/Sq Ft
Est. Value
About This Home
This home is located at 2123-2125 Hughey Dr, Reynoldsburg, OH 43068 and is currently estimated at $310,057, approximately $153 per square foot. 2123-2125 Hughey Dr is a home located in Franklin County with nearby schools including Slate Ridge Elementary School, Baldwin Road Junior High School, and Hannah J Ashton Middle School.
Ownership History
Date
Name
Owned For
Owner Type
Purchase Details
Closed on
Feb 13, 2015
Sold by
Finley William A and Finley Shelley L
Bought by
White Christopher A and Haupt Heidi M
Current Estimated Value
Purchase Details
Closed on
Nov 15, 2010
Sold by
Tcbm Invesments Llp
Bought by
Finley William A and Finley Shelley L
Purchase Details
Closed on
Jun 12, 2008
Sold by
Anderson Dorothy L
Bought by
Tcbm Investments Llp
Home Financials for this Owner
Home Financials are based on the most recent Mortgage that was taken out on this home.
Original Mortgage
$84,000
Interest Rate
6.09%
Mortgage Type
Purchase Money Mortgage
Purchase Details
Closed on
Jan 16, 2008
Sold by
Estate Of Enar L Anderson
Bought by
Anderson Dorothy L
Purchase Details
Closed on
Jun 11, 2007
Sold by
Anderson Enar L and Anderson Dorothy L
Bought by
Anderson Enar L and Anderson Dorothy L
Purchase Details
Closed on
Sep 28, 1990
Bought by
Anderson Enar L
Create a Home Valuation Report for This Property
The Home Valuation Report is an in-depth analysis detailing your home's value as well as a comparison with similar homes in the area
Home Values in the Area
Average Home Value in this Area
Purchase History
| Date | Buyer | Sale Price | Title Company |
|---|---|---|---|
| White Christopher A | $108,000 | Stella Title | |
| Finley William A | $105,000 | Stella | |
| Tcbm Investments Llp | $105,000 | Attorney | |
| Anderson Dorothy L | -- | None Available | |
| Anderson Enar L | -- | Talon Group | |
| Anderson Enar L | -- | -- |
Source: Public Records
Mortgage History
| Date | Status | Borrower | Loan Amount |
|---|---|---|---|
| Previous Owner | Tcbm Investments Llp | $84,000 |
Source: Public Records
Tax History Compared to Growth
Tax History
| Year | Tax Paid | Tax Assessment Tax Assessment Total Assessment is a certain percentage of the fair market value that is determined by local assessors to be the total taxable value of land and additions on the property. | Land | Improvement |
|---|---|---|---|---|
| 2024 | $4,750 | $91,670 | $23,070 | $68,600 |
| 2023 | $4,686 | $91,670 | $23,070 | $68,600 |
| 2022 | $3,759 | $55,170 | $8,510 | $46,660 |
| 2021 | $3,773 | $55,170 | $8,510 | $46,660 |
| 2020 | $3,847 | $55,170 | $8,510 | $46,660 |
| 2019 | $3,553 | $46,000 | $7,110 | $38,890 |
| 2018 | $3,373 | $46,000 | $7,110 | $38,890 |
| 2017 | $3,453 | $46,000 | $7,110 | $38,890 |
| 2016 | $3,409 | $39,240 | $6,860 | $32,380 |
| 2015 | $3,192 | $39,240 | $6,860 | $32,380 |
| 2014 | $3,206 | $39,240 | $6,860 | $32,380 |
| 2013 | $1,834 | $46,130 | $8,050 | $38,080 |
Source: Public Records
Map
Nearby Homes
- 6549 Santa Cruz Place
- 6682 Woodsedge Dr
- 6348 E Livingston Ave
- 6772 Gilette Dr
- 6728 Greenbush Dr
- 0 Brice Rd
- 0 Radekin Rd Unit 225029852
- 6658 Furth Dr
- 1550 Idlewild Dr
- 6584 Benjamin Dr
- 6775 Centennial Dr
- 6793 Laird Ave
- 2997 Hubbardton Place
- 1324 Idlewild Dr
- 1334 Manor Dr
- 1474 Marty Dr
- 1328 Manor Dr
- 6486 Ethan Dr
- 1888 Birkdale Dr
- 1561 Haft Dr
- 2123 Hughey Dr Unit 125
- 2135 Hughey Dr Unit 137
- 2115 Hughey Dr
- 2118 Belltree Dr
- 2126 Belltree Dr
- 2110 Belltree Dr
- 2101 Hughey Dr
- 2134 Belltree Dr
- 2147 Hughey Dr Unit 149
- 2100 Belltree Dr
- 2142 Hughey Dr
- 2128 Hughey Dr Unit 130
- 2128 Hughey Square Dr
- 2140-2142 Hughey Dr
- 2118 Hughey Dr
- 2142 Belltree Dr
- 2140 Hughey Dr Unit 142
- 2140 Hughey Dr
- 2098 Belltree Dr
- 2154 Hughey Dr