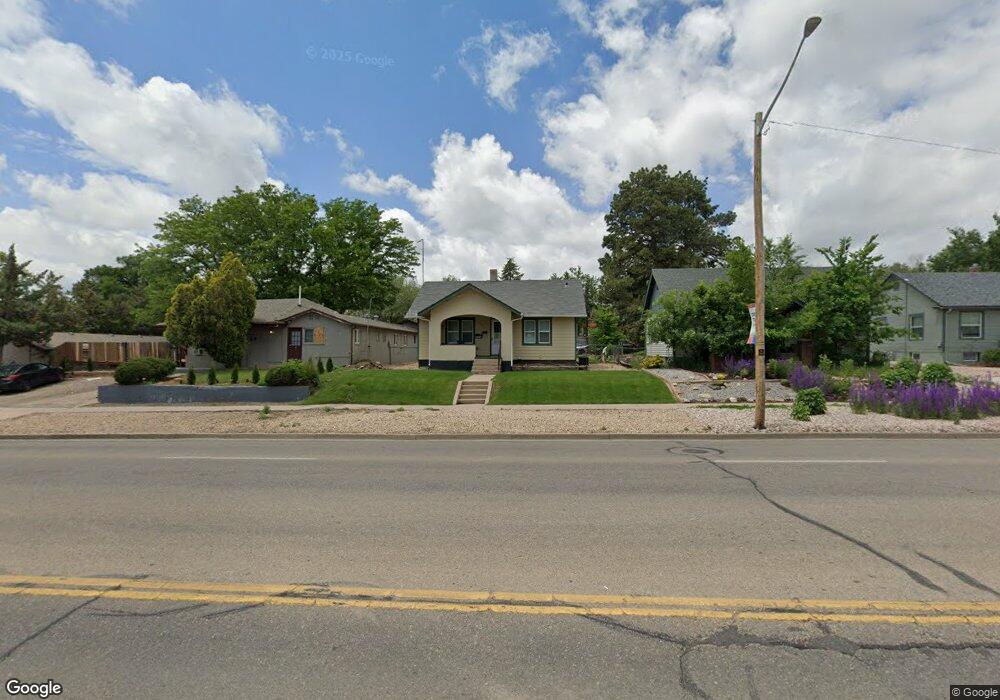
2123 8th Ave Greeley, CO 80631
Arlington Park NeighborhoodEstimated Value: $339,343 - $400,000
2
Beds
4
Baths
988
Sq Ft
$365/Sq Ft
Est. Value
About This Home
This home is located at 2123 8th Ave, Greeley, CO 80631 and is currently estimated at $360,836, approximately $365 per square foot. 2123 8th Ave is a home located in Weld County with nearby schools including Jackson Elementary School, Brentwood Middle School, and Greeley Central High School.
Ownership History
Date
Name
Owned For
Owner Type
Purchase Details
Closed on
Dec 28, 2001
Sold by
Petersen Craig and Ewald Douglas
Bought by
H E P Llc
Current Estimated Value
Purchase Details
Closed on
Nov 19, 2001
Sold by
H E P Llc
Bought by
Petersen Craig and Ewald Douglas
Purchase Details
Closed on
Jun 30, 1997
Sold by
Petersen Scott D and Petersen Michael O
Bought by
Hep Llc
Purchase Details
Closed on
Sep 27, 1993
Sold by
Thomason Christopher R
Bought by
Petersen Scott D
Purchase Details
Closed on
Sep 8, 1988
Purchase Details
Closed on
May 2, 1988
Purchase Details
Closed on
Feb 18, 1988
Purchase Details
Closed on
Jul 18, 1985
Create a Home Valuation Report for This Property
The Home Valuation Report is an in-depth analysis detailing your home's value as well as a comparison with similar homes in the area
Home Values in the Area
Average Home Value in this Area
Purchase History
| Date | Buyer | Sale Price | Title Company |
|---|---|---|---|
| H E P Llc | -- | -- | |
| Petersen Craig | -- | -- | |
| Hep Llc | $74,430 | -- | |
| Petersen Scott D | $56,000 | -- | |
| -- | -- | -- | |
| -- | -- | -- | |
| -- | -- | -- | |
| -- | -- | -- |
Source: Public Records
Tax History
| Year | Tax Paid | Tax Assessment Tax Assessment Total Assessment is a certain percentage of the fair market value that is determined by local assessors to be the total taxable value of land and additions on the property. | Land | Improvement |
|---|---|---|---|---|
| 2025 | $1,781 | $22,260 | $3,600 | $18,660 |
| 2024 | $1,781 | $22,260 | $3,600 | $18,660 |
| 2023 | $1,698 | $24,930 | $4,550 | $20,380 |
| 2022 | $1,667 | $19,120 | $3,460 | $15,660 |
| 2021 | $1,759 | $20,110 | $3,640 | $16,470 |
| 2020 | $1,522 | $17,460 | $2,940 | $14,520 |
| 2019 | $1,526 | $17,460 | $2,940 | $14,520 |
| 2018 | $1,172 | $14,150 | $2,760 | $11,390 |
| 2017 | $994 | $11,940 | $2,760 | $9,180 |
| 2016 | $738 | $9,980 | $2,290 | $7,690 |
| 2015 | $736 | $9,980 | $2,290 | $7,690 |
| 2014 | $533 | $7,060 | $1,870 | $5,190 |
Source: Public Records
Map
Nearby Homes
- 2107 9th Ave
- 922 21st St
- 2019 7th Ave
- 810 20th St
- 2220 6th Ave
- 2015 5th Ave Unit A and B
- 1802 7th Ave
- 1030 Cranford Place
- 1861 12th Ave
- 1840 12th Ave
- 1325 20th St
- 1213 Cranford Place
- 1817 12th Ave
- 1718 11th Ave
- 1864 14th Ave
- 2430 14th Avenue Ct
- 1715 11th Ave
- 1708 12th Ave
- 1626 11th Ave
- 2543 14th Ave
Your Personal Tour Guide
Ask me questions while you tour the home.