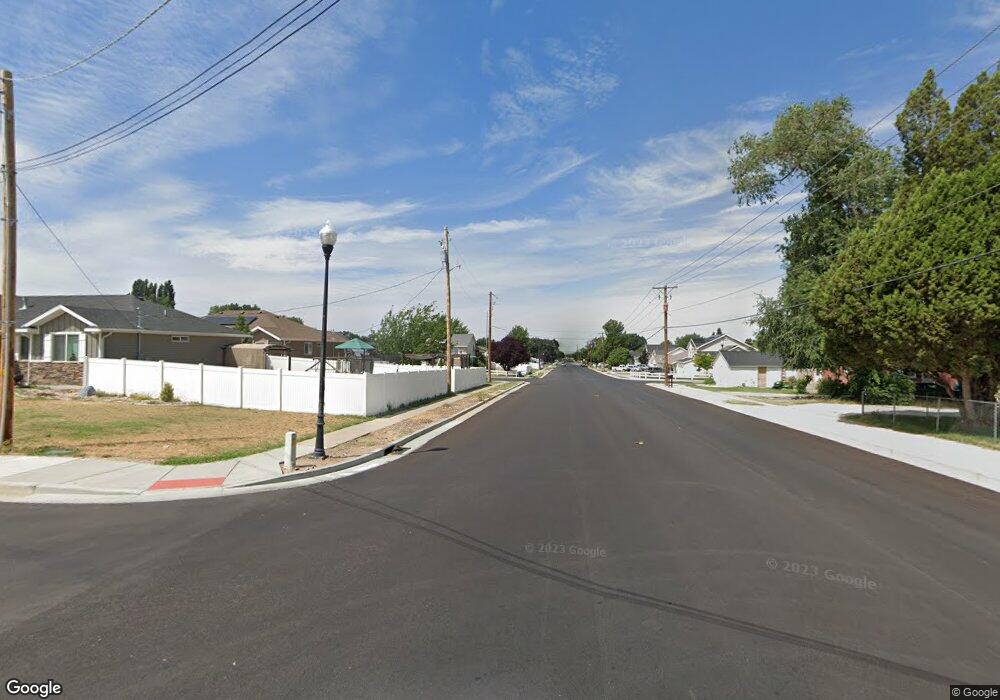
2123 N 750 W Clearfield, UT 84015
Estimated Value: $424,000 - $440,000
3
Beds
1
Bath
1,634
Sq Ft
$263/Sq Ft
Est. Value
About This Home
This home is located at 2123 N 750 W, Clearfield, UT 84015 and is currently estimated at $429,011, approximately $262 per square foot. 2123 N 750 W is a home located in Davis County with nearby schools including Fremont School, Sunset Junior High School, and Northridge High School.
Ownership History
Date
Name
Owned For
Owner Type
Purchase Details
Closed on
Oct 21, 2018
Sold by
Sherman Clinton B and Sherman Suzanne L
Bought by
Fox Haven Enterprises Llc
Current Estimated Value
Purchase Details
Closed on
Jun 19, 2009
Sold by
Mills Glen H and Mills Glen
Bought by
Mills Glen H
Purchase Details
Closed on
Apr 9, 2004
Sold by
Price Sharon K
Bought by
Mills Glen
Purchase Details
Closed on
Jan 31, 2002
Sold by
Ashwood George F
Bought by
Sherman Clinton B and Sherman Suzanne L
Home Financials for this Owner
Home Financials are based on the most recent Mortgage that was taken out on this home.
Original Mortgage
$91,000
Interest Rate
7.17%
Purchase Details
Closed on
Dec 16, 1997
Sold by
Northern Regal Homes Inc
Bought by
Ashwood George F
Purchase Details
Closed on
Jan 14, 1997
Sold by
Benchmark Real Estate Company
Bought by
Northern Regal Homes Inc
Create a Home Valuation Report for This Property
The Home Valuation Report is an in-depth analysis detailing your home's value as well as a comparison with similar homes in the area
Home Values in the Area
Average Home Value in this Area
Purchase History
| Date | Buyer | Sale Price | Title Company |
|---|---|---|---|
| Fox Haven Enterprises Llc | -- | None Available | |
| Mills Glen H | -- | None Available | |
| Mills Glen | -- | -- | |
| Sherman Clinton B | -- | Inwest Title Services Inc | |
| Ashwood George F | -- | Mountain View Title & Escrow | |
| Northern Regal Homes Inc | -- | Bonneville Title Company Inc |
Source: Public Records
Mortgage History
| Date | Status | Borrower | Loan Amount |
|---|---|---|---|
| Previous Owner | Sherman Clinton B | $91,000 |
Source: Public Records
Tax History Compared to Growth
Tax History
| Year | Tax Paid | Tax Assessment Tax Assessment Total Assessment is a certain percentage of the fair market value that is determined by local assessors to be the total taxable value of land and additions on the property. | Land | Improvement |
|---|---|---|---|---|
| 2025 | $2,134 | $205,150 | $96,953 | $108,197 |
| 2024 | $2,071 | $200,199 | $105,870 | $94,329 |
| 2023 | $1,895 | $186,450 | $66,926 | $119,523 |
| 2022 | $2,013 | $362,000 | $132,615 | $229,385 |
| 2021 | $1,840 | $270,000 | $93,850 | $176,150 |
| 2020 | $1,597 | $232,000 | $81,120 | $150,880 |
| 2019 | $1,550 | $220,000 | $92,260 | $127,740 |
| 2018 | $1,427 | $199,000 | $77,600 | $121,400 |
| 2016 | $1,319 | $94,930 | $30,501 | $64,429 |
| 2015 | $1,237 | $84,700 | $30,501 | $54,199 |
| 2014 | $1,245 | $86,537 | $30,501 | $56,036 |
| 2013 | -- | $81,369 | $27,143 | $54,226 |
Source: Public Records
Map
Nearby Homes