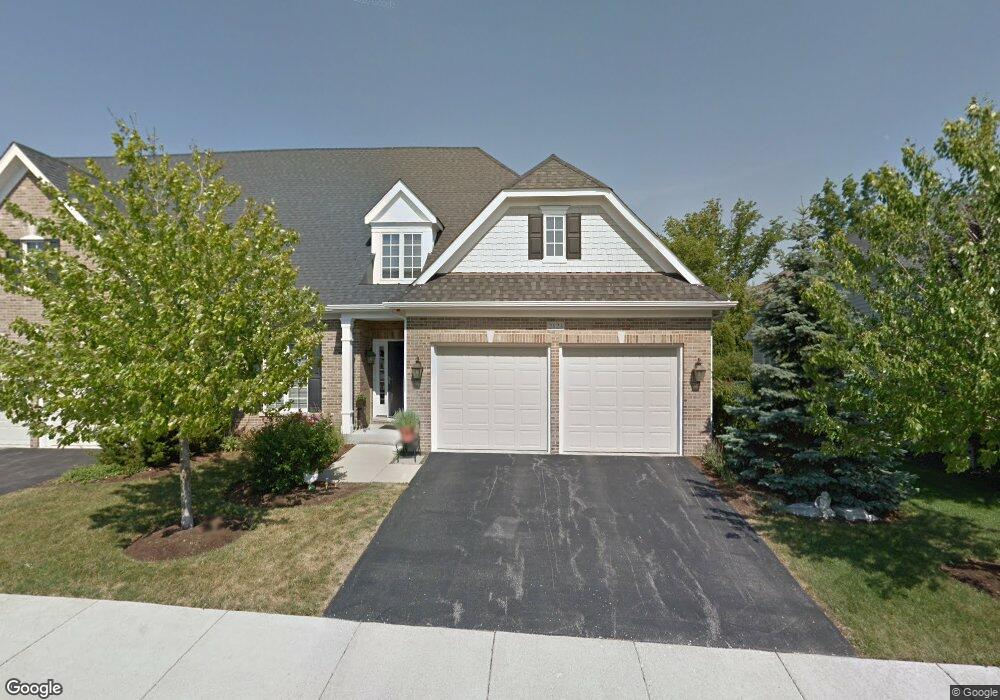
2123 Tartan Ct Wheaton, IL 60187
Hawthorne NeighborhoodEstimated Value: $695,501 - $894,000
3
Beds
3
Baths
2,801
Sq Ft
$273/Sq Ft
Est. Value
About This Home
This home is located at 2123 Tartan Ct, Wheaton, IL 60187 and is currently estimated at $764,375, approximately $272 per square foot. 2123 Tartan Ct is a home located in DuPage County with nearby schools including Washington Elementary School, Franklin Middle School, and Wheaton North High School.
Ownership History
Date
Name
Owned For
Owner Type
Purchase Details
Closed on
Aug 5, 2011
Sold by
Serwinski Nancy E and Serwinski Kenneth E
Bought by
Serwinski Nancy J and Serwinski Kenneth E
Current Estimated Value
Home Financials for this Owner
Home Financials are based on the most recent Mortgage that was taken out on this home.
Original Mortgage
$282,000
Outstanding Balance
$186,388
Interest Rate
3.62%
Mortgage Type
New Conventional
Estimated Equity
$577,987
Purchase Details
Closed on
Mar 15, 2007
Sold by
Serwinski Kenneth E and Serwinski Nancy J
Bought by
Serwinski Nancy E and Serwinski Kenneth E
Purchase Details
Closed on
Aug 31, 2005
Sold by
Chicago Title Land Trust Co
Bought by
Serwinski Kenneth E and Serwinski Nancy J
Home Financials for this Owner
Home Financials are based on the most recent Mortgage that was taken out on this home.
Original Mortgage
$275,000
Interest Rate
5.37%
Mortgage Type
Purchase Money Mortgage
Purchase Details
Closed on
Jan 27, 2004
Sold by
Cole Taylor Bank
Bought by
Cole Taylor Bank and Trust #03-9940
Create a Home Valuation Report for This Property
The Home Valuation Report is an in-depth analysis detailing your home's value as well as a comparison with similar homes in the area
Home Values in the Area
Average Home Value in this Area
Purchase History
| Date | Buyer | Sale Price | Title Company |
|---|---|---|---|
| Serwinski Nancy J | -- | Prism Title | |
| Serwinski Nancy E | -- | None Available | |
| Serwinski Kenneth E | $589,500 | Ctic | |
| Cole Taylor Bank | -- | Ctic |
Source: Public Records
Mortgage History
| Date | Status | Borrower | Loan Amount |
|---|---|---|---|
| Open | Serwinski Nancy J | $282,000 | |
| Closed | Serwinski Kenneth E | $275,000 |
Source: Public Records
Tax History
| Year | Tax Paid | Tax Assessment Tax Assessment Total Assessment is a certain percentage of the fair market value that is determined by local assessors to be the total taxable value of land and additions on the property. | Land | Improvement |
|---|---|---|---|---|
| 2024 | $12,447 | $201,125 | $28,529 | $172,596 |
| 2023 | $11,970 | $185,130 | $26,260 | $158,870 |
| 2022 | $11,869 | $177,390 | $24,820 | $152,570 |
| 2021 | $11,832 | $173,180 | $24,230 | $148,950 |
| 2020 | $11,796 | $171,560 | $24,000 | $147,560 |
| 2019 | $11,529 | $167,040 | $23,370 | $143,670 |
| 2018 | $13,782 | $196,280 | $37,370 | $158,910 |
| 2017 | $13,585 | $189,040 | $35,990 | $153,050 |
| 2016 | $13,413 | $181,490 | $34,550 | $146,940 |
| 2015 | $13,321 | $173,140 | $32,960 | $140,180 |
| 2014 | $13,455 | $171,940 | $32,730 | $139,210 |
| 2013 | $13,108 | $172,460 | $32,830 | $139,630 |
Source: Public Records
Map
Nearby Homes
- 1017 Tartan Ct
- 2009 Mackenzie Place
- 491 Timber Ridge Dr Unit 102
- 1906 N Summit St
- 835 Avon Ct
- 831 Avon Ct
- 464 S President St Unit 204
- 808 Bridle Ln
- 1607 Stoddard Ave
- 1603 Ashton Ct
- 1902 N Washington St
- 305 Maple St
- 333 Elm St
- 859 Saddlewood Dr
- 817 E Forest Ave
- 142 Kennebunk Ct Unit 32
- 731 Western Ave
- 266 Shorewood Dr Unit 2A
- 1111 Bloomingdale Rd Unit 2A
- 1111 Bloomingdale Rd Unit 2B
- 2127 Tartan Ct
- 2117 Tartan Ct
- 2131 Tartan Ct
- 2111 Tartan Ct
- 2120 Tartan Ct
- 2124 Tartan Ct
- 2100 Stoddard Ave
- 2140 Stoddard Ave
- 2120 Stoddard Ave
- 2130 Tartan Ct
- 2041 Mackenzie Place
- 2037 Mackenzie Place
- 1011 Tartan Ct
- 1018 Tartan Ct
- 1014 Tartan Ct
- 1203 Lindsay Ct
- 1202 Lindsay Ct
- 2031 Mackenzie Place
- 2027 Mackenzie Place
- 15 Geneva Rd
Your Personal Tour Guide
Ask me questions while you tour the home.