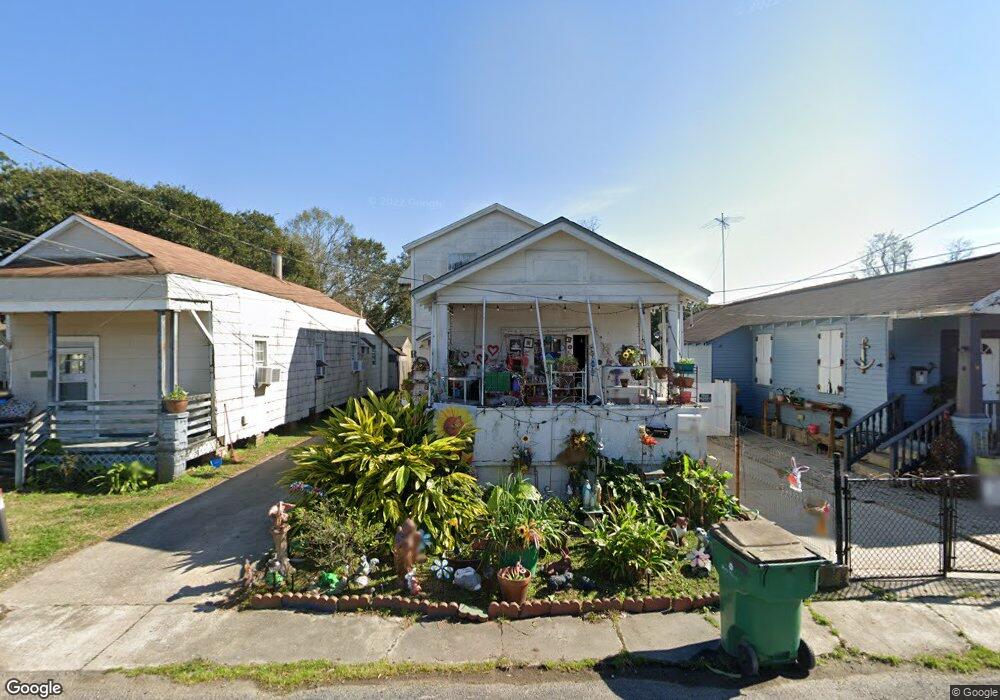
2124 Fig St Harvey, LA 70058
3
Beds
1
Bath
800
Sq Ft
--
Built
About This Home
This home is located at 2124 Fig St, Harvey, LA 70058. 2124 Fig St is a home located in Jefferson Parish with nearby schools including Gretna No. 2 Academy for Advanced Studies, L.H. Marrero Middle School, and West Jefferson High School.
Create a Home Valuation Report for This Property
The Home Valuation Report is an in-depth analysis detailing your home's value as well as a comparison with similar homes in the area
Home Values in the Area
Average Home Value in this Area
Tax History
| Year | Tax Paid | Tax Assessment Tax Assessment Total Assessment is a certain percentage of the fair market value that is determined by local assessors to be the total taxable value of land and additions on the property. | Land | Improvement |
|---|---|---|---|---|
| 2025 | $1,429 | $10,760 | $2,310 | $8,450 |
| 2024 | $8,096 | $10,760 | $2,310 | $8,450 |
| 2023 | $1,341 | $9,780 | $2,310 | $7,470 |
| 2022 | $1,309 | $9,780 | $2,310 | $7,470 |
| 2021 | $1,237 | $9,780 | $2,310 | $7,470 |
| 2020 | $1,229 | $9,780 | $2,310 | $7,470 |
| 2019 | $1,082 | $8,550 | $2,310 | $6,240 |
| 2018 | $1,013 | $8,550 | $2,310 | $6,240 |
| 2017 | $973 | $8,550 | $2,310 | $6,240 |
| 2016 | $954 | $8,550 | $2,310 | $6,240 |
| 2015 | $1,024 | $9,100 | $2,260 | $6,840 |
| 2014 | $1,024 | $9,100 | $2,260 | $6,840 |
Source: Public Records
Map
Nearby Homes
Your Personal Tour Guide
Ask me questions while you tour the home.