Estimated Value: $277,571 - $301,000
3
Beds
2
Baths
1,400
Sq Ft
$207/Sq Ft
Est. Value
About This Home
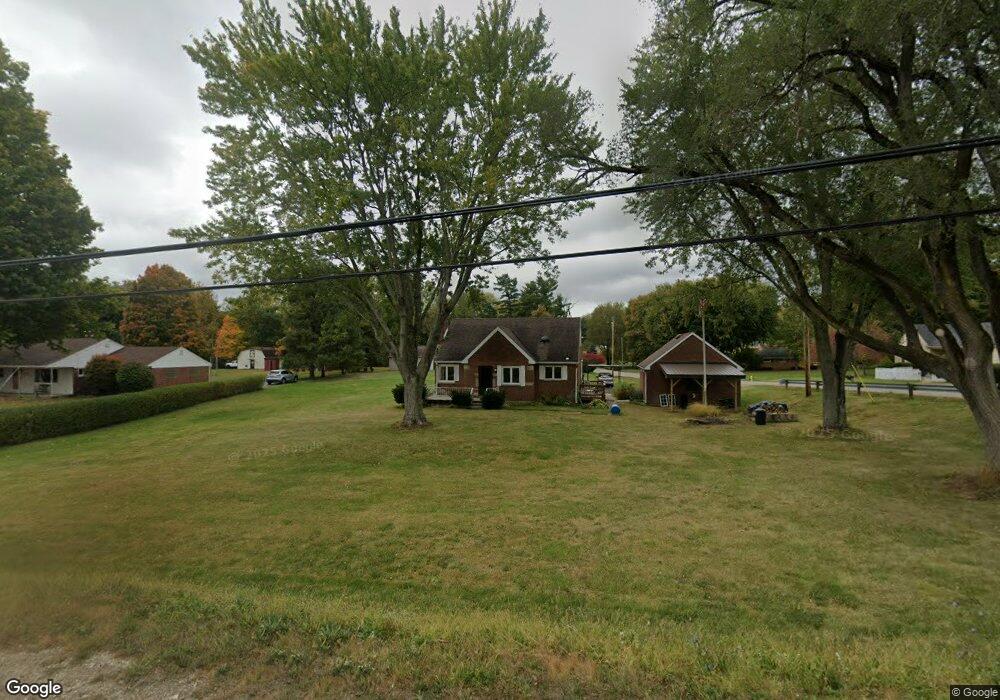
This home is located at 2124 Hilltop Rd, Xenia, OH 45385 and is currently estimated at $289,893, approximately $207 per square foot. 2124 Hilltop Rd is a home located in Greene County with nearby schools including Xenia High School.
Ownership History
Date
Name
Owned For
Owner Type
Purchase Details
Closed on
Jul 8, 2021
Sold by
Waldren Kathryn and Waldren Trust
Bought by
Dell Jonathan Loren
Current Estimated Value
Home Financials for this Owner
Home Financials are based on the most recent Mortgage that was taken out on this home.
Original Mortgage
$209,475
Interest Rate
2.7%
Mortgage Type
New Conventional
Purchase Details
Closed on
Nov 20, 2006
Sold by
Partnership One Ltd
Bought by
Waldren John A and Waldren Kathryn M
Purchase Details
Closed on
Oct 10, 2006
Sold by
Waldren John A and Waldren Kathryn
Bought by
Partnership One Ltd
Purchase Details
Closed on
Sep 14, 1998
Sold by
Waldren John Albert and Waldren Kathryn M
Bought by
Walden John A and Walden Kathryn
Purchase Details
Closed on
Sep 1, 1986
Bought by
Waldren John A and & Kathryn M Trustees
Create a Home Valuation Report for This Property
The Home Valuation Report is an in-depth analysis detailing your home's value as well as a comparison with similar homes in the area
Home Values in the Area
Average Home Value in this Area
Purchase History
| Date | Buyer | Sale Price | Title Company |
|---|---|---|---|
| Dell Jonathan Loren | $220,500 | Vantage Land Title | |
| Waldren John A | -- | Attorney | |
| Partnership One Ltd | -- | None Available | |
| Walden John A | -- | -- | |
| Waldren John A | $60,000 | -- |
Source: Public Records
Mortgage History
| Date | Status | Borrower | Loan Amount |
|---|---|---|---|
| Previous Owner | Dell Jonathan Loren | $209,475 |
Source: Public Records
Tax History Compared to Growth
Tax History
| Year | Tax Paid | Tax Assessment Tax Assessment Total Assessment is a certain percentage of the fair market value that is determined by local assessors to be the total taxable value of land and additions on the property. | Land | Improvement |
|---|---|---|---|---|
| 2024 | $2,740 | $57,770 | $14,560 | $43,210 |
| 2023 | $2,740 | $57,770 | $14,560 | $43,210 |
| 2022 | $2,611 | $49,950 | $14,560 | $35,390 |
| 2021 | $2,581 | $48,760 | $14,560 | $34,200 |
| 2020 | $2,478 | $48,760 | $14,560 | $34,200 |
| 2019 | $2,483 | $45,860 | $13,590 | $32,270 |
| 2018 | $2,492 | $45,860 | $13,590 | $32,270 |
| 2017 | $2,352 | $45,860 | $13,590 | $32,270 |
| 2016 | $2,353 | $42,600 | $12,940 | $29,660 |
| 2015 | $2,359 | $42,600 | $12,940 | $29,660 |
| 2014 | $2,263 | $42,600 | $12,940 | $29,660 |
Source: Public Records
Map
Nearby Homes
- 2448 Sutton Rd
- 2710 Sutton Rd
- 2537 Ridge Rd
- 1416 Hilltop Rd
- 15 Sexton Dr
- 2018 Tahoe Dr
- 2094 Malibu Trail
- 1481 Stone Ridge Ct
- 460 Kinsey Rd
- 1872 Harris Ln
- 965 Oak Dale Dr
- 1462 Champions Way
- 1815 Promenade Ln
- 493 Hollywood Blvd
- 499 Hollywood Blvd
- 1820 Palmer Ct
- 1814 Palmer Ct
- 1808 Palmer Ct
- 1802 Palmer Ct
- 1796 Palmer Ct
- 2111 State Route 235
- 2131 Hilltop Rd
- 2108 Hilltop Rd
- 2105 State Route 235
- 2113 Hilltop Rd
- 2089 State Route 235
- 2136 State Route 235
- 2190 Hilltop Rd
- 2065 State Route 235
- 2098 Hilltop Rd
- 2074 Hilltop Rd
- 2189 State Route 235
- 2045 State Route 235
- 2165 Hilltop Rd
- 2093 Hilltop Rd
- 2058 Hilltop Rd
- 2187 State Route 235
- 2025 State Route 235
- 2050 Hilltop Rd
- 2023 State Route 235