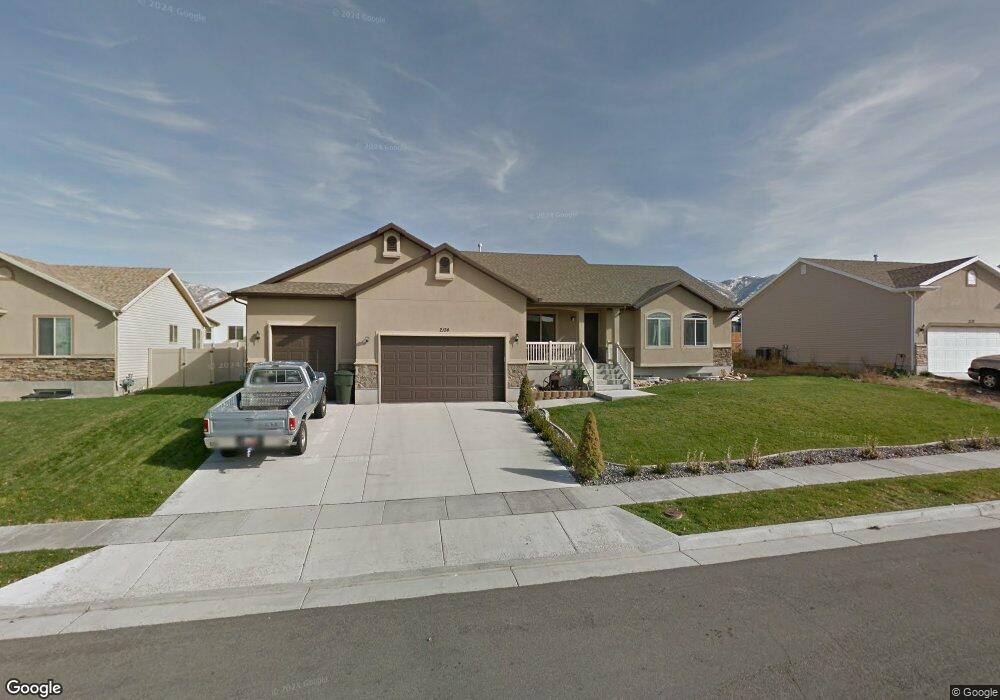
2124 N 170 W Tooele, UT 84074
Estimated Value: $501,952 - $537,000
3
Beds
2
Baths
3,156
Sq Ft
$165/Sq Ft
Est. Value
About This Home
This home is located at 2124 N 170 W, Tooele, UT 84074 and is currently estimated at $520,738, approximately $164 per square foot. 2124 N 170 W is a home located in Tooele County with nearby schools including Overlake Elementary School, Clarke N. Johnsen Junior High School, and Stansbury High School.
Ownership History
Date
Name
Owned For
Owner Type
Purchase Details
Closed on
Oct 27, 2015
Sold by
Torres Albert A and Torres Cecilia F
Bought by
Blazzard Michael T and Blazzard Heather M
Current Estimated Value
Home Financials for this Owner
Home Financials are based on the most recent Mortgage that was taken out on this home.
Original Mortgage
$247,902
Outstanding Balance
$195,515
Interest Rate
3.87%
Mortgage Type
VA
Estimated Equity
$325,223
Purchase Details
Closed on
Oct 14, 2009
Sold by
Hallmark Homes And Development
Bought by
Torres Albert A and Torres Cecilia F
Home Financials for this Owner
Home Financials are based on the most recent Mortgage that was taken out on this home.
Original Mortgage
$230,000
Interest Rate
5.02%
Mortgage Type
VA
Create a Home Valuation Report for This Property
The Home Valuation Report is an in-depth analysis detailing your home's value as well as a comparison with similar homes in the area
Home Values in the Area
Average Home Value in this Area
Purchase History
| Date | Buyer | Sale Price | Title Company |
|---|---|---|---|
| Blazzard Michael T | -- | None Available | |
| Torres Albert A | -- | Metro National Title |
Source: Public Records
Mortgage History
| Date | Status | Borrower | Loan Amount |
|---|---|---|---|
| Open | Blazzard Michael T | $247,902 | |
| Previous Owner | Torres Albert A | $230,000 |
Source: Public Records
Tax History Compared to Growth
Tax History
| Year | Tax Paid | Tax Assessment Tax Assessment Total Assessment is a certain percentage of the fair market value that is determined by local assessors to be the total taxable value of land and additions on the property. | Land | Improvement |
|---|---|---|---|---|
| 2025 | $2,949 | $432,114 | $110,000 | $322,114 |
| 2024 | $3,218 | $237,980 | $60,500 | $177,480 |
| 2023 | $3,218 | $250,502 | $57,608 | $192,894 |
| 2022 | $2,799 | $231,257 | $70,290 | $160,967 |
| 2021 | $2,620 | $179,993 | $23,238 | $156,755 |
| 2020 | $2,453 | $296,722 | $42,250 | $254,472 |
| 2019 | $2,376 | $284,604 | $42,250 | $242,354 |
| 2018 | $2,153 | $245,385 | $40,000 | $205,385 |
| 2017 | $1,721 | $231,949 | $40,000 | $191,949 |
| 2016 | $1,564 | $116,471 | $16,500 | $99,971 |
| 2015 | $1,564 | $110,932 | $0 | $0 |
| 2014 | -- | $110,932 | $0 | $0 |
Source: Public Records
Map
Nearby Homes
- 2117 N 170 W
- 2155 N 170 W
- 2057 N Loxley Dr
- 2065 N Loxley Dr
- 81 W 1930 N
- 69 1930 N
- 1909 N 70 W
- 1893 N 70 W
- 1893 N 70 W Unit 620
- 1885 N 70 W Unit 619
- 1877 N 70 W Unit 618
- 535 W 2030 N Unit 23
- 1861 N 70 W Unit 616
- 228 W 2370 N
- 2098 N 425 W Unit 240
- 2098 N 425 W
- 2157 N 425 W Unit 233
- 2157 N 425 W
- 1913 N 370 W
- Drysdale Twinhomes Plan at Drysdale Twinhomes