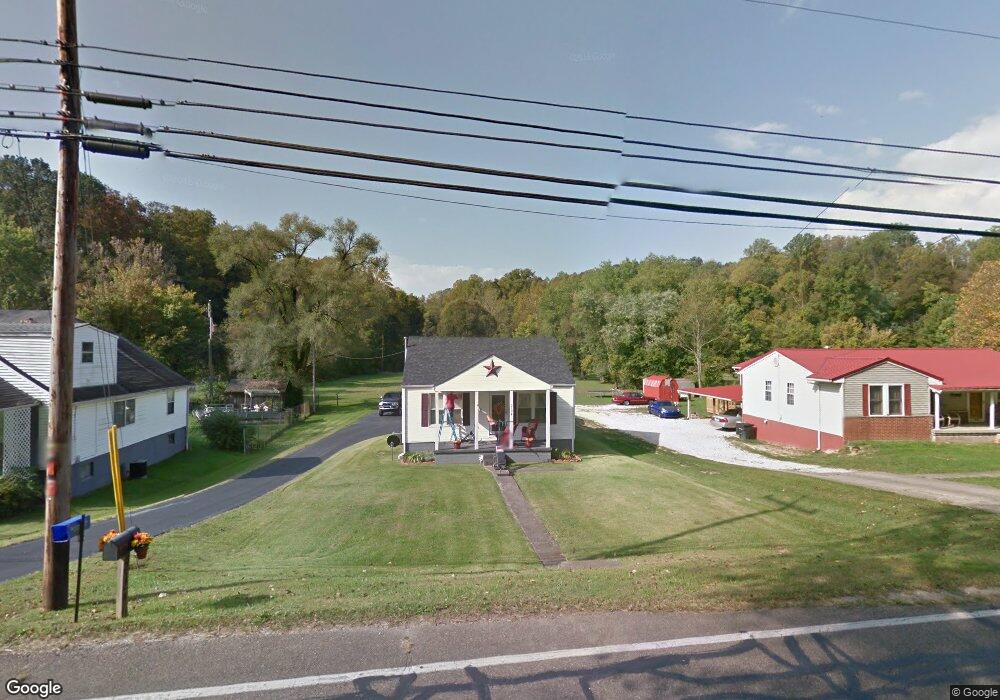
2124 State Route 243 Ironton, OH 45638
Estimated Value: $112,000 - $138,000
2
Beds
1
Bath
928
Sq Ft
$134/Sq Ft
Est. Value
About This Home
This home is located at 2124 State Route 243, Ironton, OH 45638 and is currently estimated at $124,515, approximately $134 per square foot. 2124 State Route 243 is a home located in Lawrence County with nearby schools including Dawson-Bryant Elementary School, Dawson-Bryant Middle School, and Dawson-Bryant High School.
Ownership History
Date
Name
Owned For
Owner Type
Purchase Details
Closed on
Jun 7, 2021
Sold by
Rowe Tresia and Betty L Pinkerman Trust
Bought by
Loudenburg Melinda J and Wilson Michael B
Current Estimated Value
Home Financials for this Owner
Home Financials are based on the most recent Mortgage that was taken out on this home.
Original Mortgage
$91,315
Outstanding Balance
$82,674
Interest Rate
2.9%
Mortgage Type
FHA
Estimated Equity
$41,841
Purchase Details
Closed on
Nov 5, 2010
Sold by
Pinkerman Kinner
Bought by
Pinkerman Kinner L and The Betty L Pinkerman Trust
Purchase Details
Closed on
Sep 3, 2010
Sold by
Kidd Beverly J and Kidd Blaine
Bought by
Pinkerman Kinner
Purchase Details
Closed on
Sep 15, 2000
Sold by
Pinkerman Betty
Bought by
Pinkerman Betty Life Est
Purchase Details
Closed on
Jun 9, 1998
Sold by
Pinkerman Charles W and Pinkerman B
Bought by
Pinkerman Betty
Create a Home Valuation Report for This Property
The Home Valuation Report is an in-depth analysis detailing your home's value as well as a comparison with similar homes in the area
Home Values in the Area
Average Home Value in this Area
Purchase History
| Date | Buyer | Sale Price | Title Company |
|---|---|---|---|
| Loudenburg Melinda J | $93,000 | Bestitle | |
| Pinkerman Kinner L | -- | Attorney | |
| Pinkerman Kinner | $11,210 | Attorney | |
| Pinkerman Betty Life Est | -- | -- | |
| Pinkerman Betty | -- | -- |
Source: Public Records
Mortgage History
| Date | Status | Borrower | Loan Amount |
|---|---|---|---|
| Open | Loudenburg Melinda J | $91,315 |
Source: Public Records
Tax History Compared to Growth
Tax History
| Year | Tax Paid | Tax Assessment Tax Assessment Total Assessment is a certain percentage of the fair market value that is determined by local assessors to be the total taxable value of land and additions on the property. | Land | Improvement |
|---|---|---|---|---|
| 2024 | -- | $20,500 | $4,350 | $16,150 |
| 2023 | $588 | $20,500 | $4,350 | $16,150 |
| 2022 | $586 | $20,500 | $4,350 | $16,150 |
| 2021 | $294 | $19,170 | $4,110 | $15,060 |
| 2020 | $310 | $19,170 | $4,110 | $15,060 |
| 2019 | $309 | $19,170 | $4,110 | $15,060 |
| 2018 | $294 | $18,540 | $4,110 | $14,430 |
| 2017 | $293 | $18,540 | $4,110 | $14,430 |
| 2016 | $269 | $18,540 | $4,110 | $14,430 |
| 2015 | $231 | $16,450 | $4,120 | $12,330 |
| 2014 | $228 | $16,450 | $4,120 | $12,330 |
| 2013 | $228 | $16,450 | $4,120 | $12,330 |
Source: Public Records
Map
Nearby Homes
- 2088 State Route 243
- 342 Township Road 296
- 156 Township Road 181
- 103 Carrico Dr
- 119 Remy St
- 519 Lane St
- 514 Lane St
- 135 Lane St
- 805 1/2 High St
- 125 Center St
- 309 High St
- 309 High St Unit LAO-5
- 0 Carter Ave
- 1824 Carter Ave
- 2135 Central Ave
- 0 Central Ave
- 0 18th Street & Central Ave
- 0 27th Block of Carter Ave
- 2829 Carter Ave
- 0 Central & Mlk
- 2108 State Route 243
- 2124 Ohio 243
- 2133 State Route 243
- 2068 State Route 243
- 2052 State Route 243
- 2191 State Route 243
- 2191 Ohio 243
- 24 Pvt Dr 2057 State Route 243
- 2160 State Route 243
- 2033 State Route 243
- 2024 State Route 243
- 208 Township Road 296
- 2009 State Route 243
- 1992 State Route 243
- 1991 State Route 243
- 1972 State Route 243
- 1960 State Route 243
- 1948 State Route 243
- 1930 State Route 243
- 2288 State Route 243