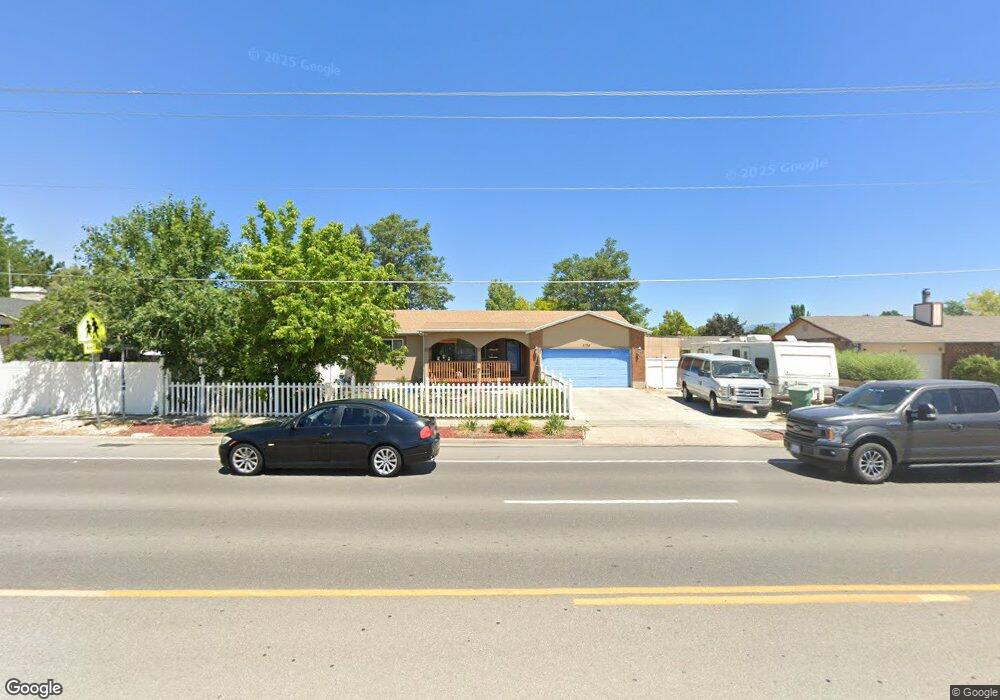
2124 W 7000 S West Jordan, UT 84084
Estimated Value: $493,000 - $540,000
4
Beds
3
Baths
2,172
Sq Ft
$239/Sq Ft
Est. Value
About This Home
This home is located at 2124 W 7000 S, West Jordan, UT 84084 and is currently estimated at $519,052, approximately $238 per square foot. 2124 W 7000 S is a home located in Salt Lake County with nearby schools including West Jordan School, Majestic Elementary Arts Academy, and West Jordan Middle School.
Ownership History
Date
Name
Owned For
Owner Type
Purchase Details
Closed on
Aug 20, 2020
Sold by
Mejia Marco
Bought by
Mejia Marco and Mejia Rocio
Current Estimated Value
Home Financials for this Owner
Home Financials are based on the most recent Mortgage that was taken out on this home.
Original Mortgage
$75,000
Outstanding Balance
$53,255
Interest Rate
3%
Mortgage Type
New Conventional
Estimated Equity
$465,797
Purchase Details
Closed on
Dec 13, 2018
Sold by
Mejia Marco and Mejia Rocio
Bought by
Mejia Marco and Mejia Rocio
Purchase Details
Closed on
Oct 26, 1998
Sold by
Derosier Paulette R
Bought by
Mejia Marco A and Mejia Rocio
Home Financials for this Owner
Home Financials are based on the most recent Mortgage that was taken out on this home.
Original Mortgage
$102,400
Interest Rate
6.71%
Create a Home Valuation Report for This Property
The Home Valuation Report is an in-depth analysis detailing your home's value as well as a comparison with similar homes in the area
Home Values in the Area
Average Home Value in this Area
Purchase History
| Date | Buyer | Sale Price | Title Company |
|---|---|---|---|
| Mejia Marco | -- | Vanguard Title Ins Agcy | |
| Mejia Marco | -- | Vantage Title Ins Agcy | |
| Mejia Marco | -- | None Available | |
| Mejia Marco A | -- | -- |
Source: Public Records
Mortgage History
| Date | Status | Borrower | Loan Amount |
|---|---|---|---|
| Open | Mejia Marco | $75,000 | |
| Closed | Mejia Marco A | $102,400 |
Source: Public Records
Tax History Compared to Growth
Tax History
| Year | Tax Paid | Tax Assessment Tax Assessment Total Assessment is a certain percentage of the fair market value that is determined by local assessors to be the total taxable value of land and additions on the property. | Land | Improvement |
|---|---|---|---|---|
| 2025 | $2,436 | $490,600 | $107,600 | $383,000 |
| 2024 | $2,436 | $468,700 | $101,500 | $367,200 |
| 2023 | $2,470 | $447,800 | $93,900 | $353,900 |
| 2022 | $2,529 | $451,100 | $92,100 | $359,000 |
| 2021 | $2,054 | $333,600 | $72,000 | $261,600 |
| 2020 | $1,917 | $292,200 | $72,000 | $220,200 |
| 2019 | $1,878 | $280,700 | $72,000 | $208,700 |
| 2018 | $1,636 | $242,500 | $69,700 | $172,800 |
| 2017 | $1,532 | $226,100 | $69,700 | $156,400 |
| 2016 | $1,466 | $203,300 | $69,700 | $133,600 |
| 2015 | $1,456 | $196,900 | $74,300 | $122,600 |
| 2014 | $1,405 | $187,000 | $71,000 | $116,000 |
Source: Public Records
Map
Nearby Homes
- 6924 S 2160 W
- 6925 S Lexington Dr
- 2312 W Hidden Bend Cove Unit 107
- 1951 W 7125 S
- 7150 Camelot Way
- 7149 S Camelot Way
- 2421 W 6900 S
- 2178 W Arthur Dr
- 7279 S Kenadi Ct
- 6918 S Harvest Cir
- 1718 W Trey Way Unit 2
- 1607 W Beamon St
- 2683 W Carson Ln
- 7118 S Equator Ln Unit 14 B
- 2333 W Ledgewood Dr
- 2510 W Jordan Meadows Ln
- 7165 Callie Dr
- 7174 S 1380 W
- 7194 S 1380 W
- 7361 S 2700 W