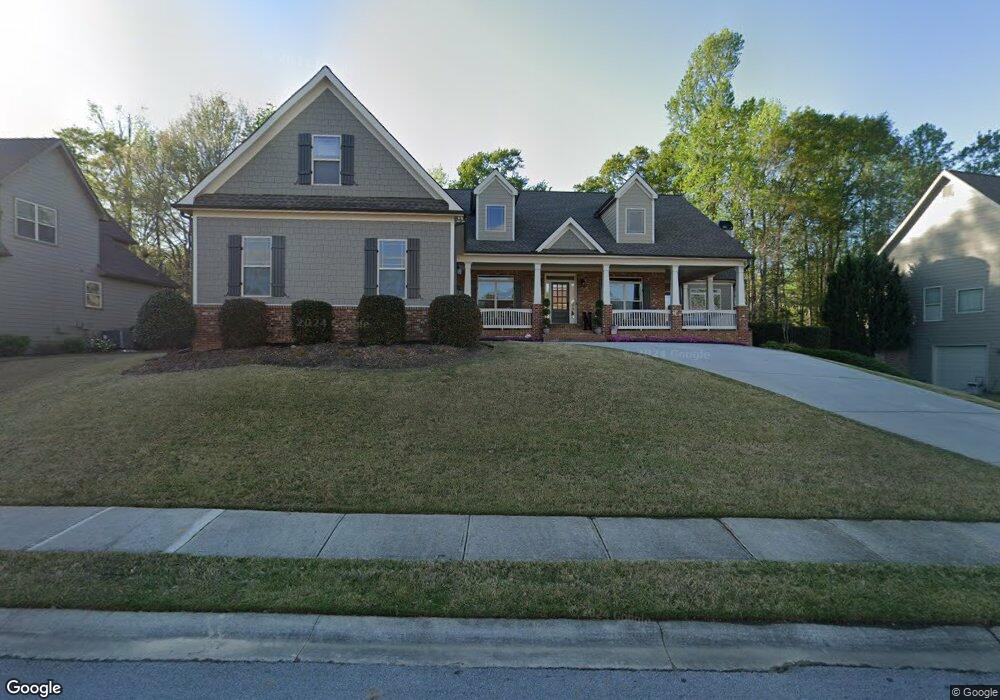
2125 Independence Ln Buford, GA 30519
Estimated Value: $612,000 - $693,000
4
Beds
4
Baths
3,365
Sq Ft
$196/Sq Ft
Est. Value
About This Home
This home is located at 2125 Independence Ln, Buford, GA 30519 and is currently estimated at $658,380, approximately $195 per square foot. 2125 Independence Ln is a home located in Hall County with nearby schools including Friendship Elementary School, Cherokee Bluff Middle School, and Cherokee Bluff High School.
Ownership History
Date
Name
Owned For
Owner Type
Purchase Details
Closed on
Dec 24, 2013
Sold by
Lioi Gina
Bought by
Nuzzo Jr Alphonse M and Nuzzo Jr Gina M
Current Estimated Value
Home Financials for this Owner
Home Financials are based on the most recent Mortgage that was taken out on this home.
Original Mortgage
$337,000
Outstanding Balance
$252,677
Interest Rate
4.29%
Mortgage Type
New Conventional
Estimated Equity
$405,703
Purchase Details
Closed on
Feb 6, 2008
Sold by
Greenwood Builder Group Inc
Bought by
Lioi Gina
Home Financials for this Owner
Home Financials are based on the most recent Mortgage that was taken out on this home.
Original Mortgage
$364,800
Interest Rate
6.17%
Mortgage Type
New Conventional
Purchase Details
Closed on
Feb 6, 2006
Sold by
Chateau Corners Development Corp
Bought by
Embry Custom Homes Llc
Home Financials for this Owner
Home Financials are based on the most recent Mortgage that was taken out on this home.
Original Mortgage
$299,925
Interest Rate
6.14%
Create a Home Valuation Report for This Property
The Home Valuation Report is an in-depth analysis detailing your home's value as well as a comparison with similar homes in the area
Home Values in the Area
Average Home Value in this Area
Purchase History
| Date | Buyer | Sale Price | Title Company |
|---|---|---|---|
| Nuzzo Jr Alphonse M | -- | -- | |
| Lioi Gina | $385,000 | -- | |
| Embry Custom Homes Llc | $2,085,000 | -- |
Source: Public Records
Mortgage History
| Date | Status | Borrower | Loan Amount |
|---|---|---|---|
| Open | Nuzzo Jr Alphonse M | $337,000 | |
| Closed | Nuzzo Jr Alphonse M | $337,000 | |
| Previous Owner | Lioi Gina | $364,800 | |
| Previous Owner | Embry Custom Homes Llc | $299,925 |
Source: Public Records
Tax History Compared to Growth
Tax History
| Year | Tax Paid | Tax Assessment Tax Assessment Total Assessment is a certain percentage of the fair market value that is determined by local assessors to be the total taxable value of land and additions on the property. | Land | Improvement |
|---|---|---|---|---|
| 2024 | $6,310 | $253,360 | $40,280 | $213,080 |
| 2023 | $4,801 | $209,840 | $29,200 | $180,640 |
| 2022 | $4,859 | $187,760 | $27,600 | $160,160 |
| 2021 | $4,198 | $159,560 | $17,000 | $142,560 |
| 2020 | $4,175 | $154,280 | $17,000 | $137,280 |
| 2019 | $4,037 | $147,920 | $16,000 | $131,920 |
| 2018 | $4,217 | $149,560 | $16,000 | $133,560 |
| 2017 | $4,171 | $144,440 | $12,000 | $132,440 |
| 2016 | $3,539 | $125,760 | $12,000 | $113,760 |
| 2015 | $3,285 | $125,760 | $12,000 | $113,760 |
| 2014 | $3,285 | $115,997 | $12,000 | $103,997 |
Source: Public Records
Map
Nearby Homes
- 2228 Mayors Way
- 7235 Coral Lake Dr
- 7272 Coral Lake Dr
- 2638 Democracy Dr Unit 1
- 7343 Peacebrook Dr
- 7464 Williams Rd
- 2342 Sparta Way
- 3088 Lantana Way
- 3138 Lantana Way
- Sierra Plan at Sherwood Square
- Sawnee Plan at Sherwood Square
- 3134 Perimeter Cir
- 7289 Mulberry Trace Ln Unit LOT 178
- 2941 Climbing Rose St
- 7296 Mulberry Trace Ln Unit LOT 180
- 7296 Mulberry Trace Ln
- 7207 Spout Springs Rd
- 7300 Mulberry Trace Ln
- 7300 Mulberry Trace Ln Unit LOT 181
- 7304 Mulberry Trace Ln Unit LOT 182
- 2117 Independence Ln
- 2085 Democracy Dr
- 2081 Democracy Dr
- 2135 Independence Ln
- 2128 Independence Ln
- 2109 Independence Ln Unit 175
- 2109 Independence Ln
- 2124 Independence Ln
- 2077 Democracy Dr
- 2132 Independence Ln
- 2105 Independence Ln
- 2136 Independence Ln
- 2120 Independence Ln
- 0 Independence Ln Unit 8567350
- 0 Independence Ln Unit 8415832
- 0 Independence Ln Unit 8067075
- 0 Independence Ln Unit 8000137
- 0 Independence Ln Unit 9057049
- 0 Independence Ln Unit 3164123
- 0 Independence Ln