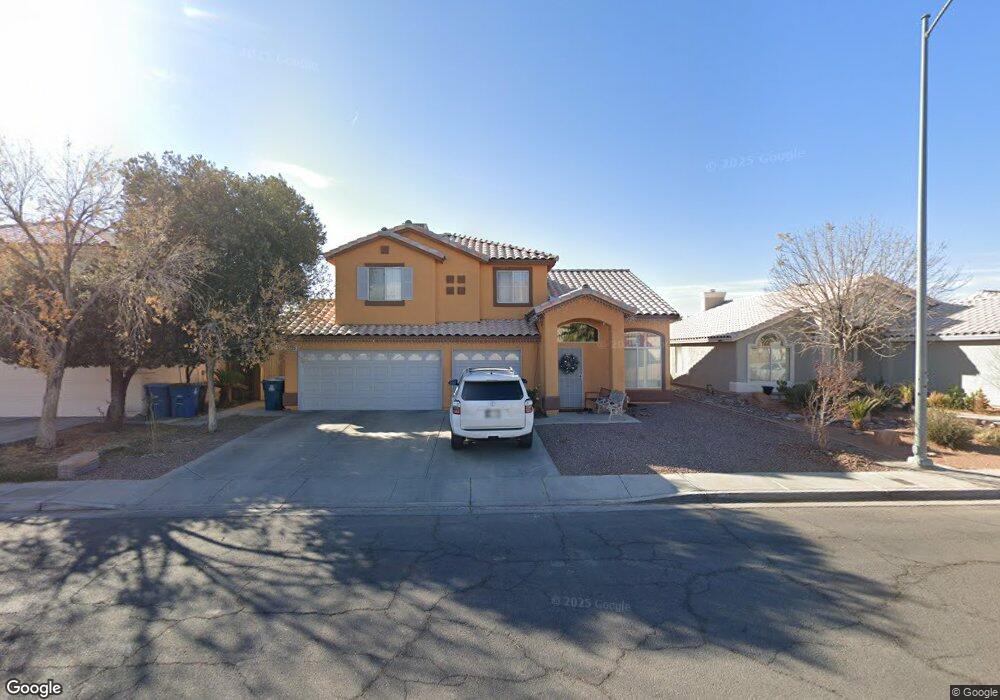
2125 Kapok Tree Ln Las Vegas, NV 89142
Estimated Value: $432,033 - $474,000
4
Beds
3
Baths
2,024
Sq Ft
$221/Sq Ft
Est. Value
About This Home
This home is located at 2125 Kapok Tree Ln, Las Vegas, NV 89142 and is currently estimated at $447,008, approximately $220 per square foot. 2125 Kapok Tree Ln is a home located in Clark County with nearby schools including Dan Goldfarb Elementary School, Kathleen & Tim Harney Middle School, and Las Vegas High School.
Ownership History
Date
Name
Owned For
Owner Type
Purchase Details
Closed on
Nov 27, 2006
Sold by
Quizon Roberto D and Quizon Marivic L
Bought by
Dabu Aurora
Current Estimated Value
Home Financials for this Owner
Home Financials are based on the most recent Mortgage that was taken out on this home.
Original Mortgage
$256,080
Outstanding Balance
$157,802
Interest Rate
6.87%
Mortgage Type
Unknown
Estimated Equity
$289,206
Purchase Details
Closed on
Nov 14, 2006
Sold by
Dabu Jesus R
Bought by
Dabu Aurora
Home Financials for this Owner
Home Financials are based on the most recent Mortgage that was taken out on this home.
Original Mortgage
$256,080
Outstanding Balance
$157,802
Interest Rate
6.87%
Mortgage Type
Unknown
Estimated Equity
$289,206
Purchase Details
Closed on
Aug 4, 1995
Sold by
Lewis Properties
Bought by
Quizon Robert D and Quizon Marivic L
Home Financials for this Owner
Home Financials are based on the most recent Mortgage that was taken out on this home.
Original Mortgage
$134,793
Interest Rate
7.61%
Mortgage Type
Assumption
Create a Home Valuation Report for This Property
The Home Valuation Report is an in-depth analysis detailing your home's value as well as a comparison with similar homes in the area
Home Values in the Area
Average Home Value in this Area
Purchase History
| Date | Buyer | Sale Price | Title Company |
|---|---|---|---|
| Dabu Aurora | $320,100 | Lawyers Title Of Nevada | |
| Dabu Aurora | -- | Lawyers Title Of Nevada | |
| Quizon Robert D | $132,500 | Stewart Title |
Source: Public Records
Mortgage History
| Date | Status | Borrower | Loan Amount |
|---|---|---|---|
| Open | Dabu Aurora | $256,080 | |
| Previous Owner | Quizon Robert D | $134,793 |
Source: Public Records
Tax History Compared to Growth
Tax History
| Year | Tax Paid | Tax Assessment Tax Assessment Total Assessment is a certain percentage of the fair market value that is determined by local assessors to be the total taxable value of land and additions on the property. | Land | Improvement |
|---|---|---|---|---|
| 2025 | $1,364 | $90,855 | $24,850 | $66,005 |
| 2024 | $1,325 | $90,855 | $24,850 | $66,005 |
| 2023 | $1,081 | $91,657 | $28,700 | $62,957 |
| 2022 | $1,287 | $81,161 | $23,450 | $57,711 |
| 2021 | $1,249 | $76,437 | $21,350 | $55,087 |
| 2020 | $1,210 | $75,314 | $20,650 | $54,664 |
| 2019 | $1,175 | $71,790 | $17,850 | $53,940 |
| 2018 | $1,140 | $66,608 | $14,700 | $51,908 |
| 2017 | $1,937 | $66,045 | $13,300 | $52,745 |
| 2016 | $1,081 | $55,002 | $9,450 | $45,552 |
| 2015 | $1,078 | $45,225 | $8,050 | $37,175 |
| 2014 | $1,044 | $36,463 | $7,000 | $29,463 |
Source: Public Records
Map
Nearby Homes
- 6131 Pumpkin Patch Ave
- 6233 Apple Orchard Dr
- 2316 Tulip Field St
- 2179 Raspberry Hill Rd
- 6260 Peach Orchard Rd
- 1779 Pineapple Tree Ct
- 1927 Raspberry Hill Rd
- 6080 Saint Petersburg Dr
- 6170 E Sahara Ave Unit 1031
- 6170 E Sahara Ave Unit 1076
- 6311 American Beauty Ave
- 6275 Allspice Ct
- 6092 Golden Nectar Way
- 6028 Las Nubes Dr
- 2234 Falling Rain Dr
- 1950 Turtlerock St
- 6094 Bing Cherry Dr
- 6384 Cornstalk Cir
- 1747 Angel Falls St
- 6058 Grape Blossom Ave
- 2115 Kapok Tree Ln
- 2137 Kapok Tree Ln
- 2146 Orchard Valley Dr
- 2101 Kapok Tree Ln
- 2158 Orchard Valley Dr
- 2134 Orchard Valley Dr
- 6202 Apple Orchard Dr
- 2122 Orchard Valley Dr
- 2089 Kapok Tree Ln
- 6199 Back Woods Rd
- 6185 Apple Orchard Dr
- 6177 Apple Orchard Dr
- 6210 Apple Orchard Dr
- 2110 Orchard Valley Dr
- 6193 Apple Orchard Dr
- 6169 Apple Orchard Dr
- 6201 Apple Orchard Dr
- 6186 Back Woods Rd
- 2077 Kapok Tree Ln