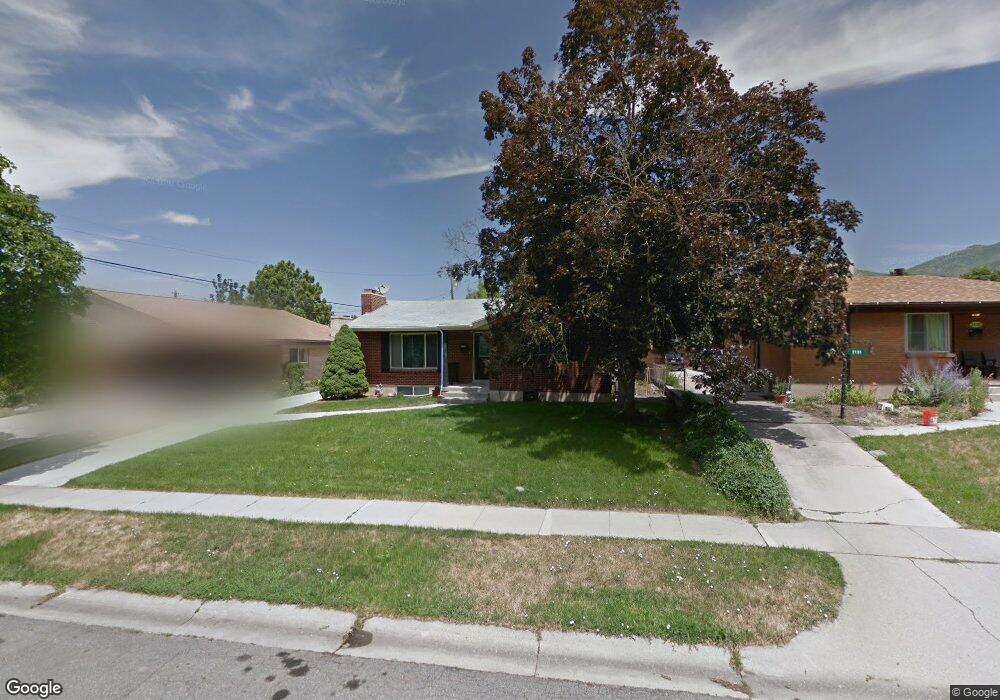
2125 Logan Ave Salt Lake City, UT 84108
Bonneville Hills NeighborhoodEstimated Value: $767,000 - $1,009,000
2
Beds
1
Bath
2,304
Sq Ft
$381/Sq Ft
Est. Value
About This Home
This home is located at 2125 Logan Ave, Salt Lake City, UT 84108 and is currently estimated at $878,956, approximately $381 per square foot. 2125 Logan Ave is a home located in Salt Lake County with nearby schools including Beacon Heights School, Hillside Middle School, and Highland High School.
Ownership History
Date
Name
Owned For
Owner Type
Purchase Details
Closed on
Mar 16, 2020
Sold by
Coyle Troy J and Coyle Barbara G
Bought by
Coyle Troy J and Coyle Barbara G
Current Estimated Value
Purchase Details
Closed on
Dec 18, 2012
Sold by
Northshore Properties Inc
Bought by
Coyle Barbara G and Coyle Troy J
Purchase Details
Closed on
Jul 9, 2008
Sold by
Coyle Barbara G and Coyle Troy J
Bought by
Northshore Properties Inc
Home Financials for this Owner
Home Financials are based on the most recent Mortgage that was taken out on this home.
Original Mortgage
$318,750
Interest Rate
6.31%
Mortgage Type
Purchase Money Mortgage
Purchase Details
Closed on
Mar 5, 2008
Sold by
Dunham Theo K
Bought by
Coyle Barbara G and Coyle Troy J
Home Financials for this Owner
Home Financials are based on the most recent Mortgage that was taken out on this home.
Original Mortgage
$241,200
Interest Rate
5.65%
Mortgage Type
Purchase Money Mortgage
Purchase Details
Closed on
Aug 24, 1995
Sold by
Ulrich Herman D and Estate Of Ethel Gwen Henry
Bought by
Dunham Theo K
Create a Home Valuation Report for This Property
The Home Valuation Report is an in-depth analysis detailing your home's value as well as a comparison with similar homes in the area
Home Values in the Area
Average Home Value in this Area
Purchase History
| Date | Buyer | Sale Price | Title Company |
|---|---|---|---|
| Coyle Troy J | -- | None Available | |
| Coyle Barbara G | -- | Bonneville Superior Title | |
| Northshore Properties Inc | -- | Cottonwood Title | |
| Coyle Barbara G | -- | First American Title | |
| Dunham Theo K | -- | -- |
Source: Public Records
Mortgage History
| Date | Status | Borrower | Loan Amount |
|---|---|---|---|
| Previous Owner | Northshore Properties Inc | $318,750 | |
| Previous Owner | Coyle Barbara G | $241,200 |
Source: Public Records
Tax History Compared to Growth
Tax History
| Year | Tax Paid | Tax Assessment Tax Assessment Total Assessment is a certain percentage of the fair market value that is determined by local assessors to be the total taxable value of land and additions on the property. | Land | Improvement |
|---|---|---|---|---|
| 2025 | $3,188 | $642,100 | $215,200 | $426,900 |
| 2024 | $3,188 | $608,200 | $205,400 | $402,800 |
| 2023 | $3,158 | $580,800 | $197,500 | $383,300 |
| 2022 | $3,467 | $598,300 | $193,600 | $404,700 |
| 2021 | $3,054 | $477,100 | $157,100 | $320,000 |
| 2020 | $2,888 | $429,500 | $144,300 | $285,200 |
| 2019 | $2,655 | $371,500 | $127,400 | $244,100 |
| 2018 | $2,449 | $333,700 | $127,400 | $206,300 |
| 2017 | $2,532 | $323,200 | $127,400 | $195,800 |
| 2016 | $2,612 | $316,600 | $127,400 | $189,200 |
| 2015 | $2,532 | $290,900 | $124,800 | $166,100 |
| 2014 | $2,475 | $282,100 | $124,800 | $157,300 |
Source: Public Records
Map
Nearby Homes
- 2125 Logan Ave S
- 1970 E Tartan Ave
- 1970 Logan Ave S
- 2138 E Wilson Ave
- 2266 E Kensington Ave
- 2366 Logan Ave S
- 1540 Preston St
- 1583 S 1900 E
- 2326 E 1700 S
- 1980 Downington Ave S
- 1784 S 1900 E
- 1444 Beacon Dr
- 1502 S 2400 E
- 2225 Ramona Ave
- 2009 E Hollywood Ave
- 1775 E Rosecrest Dr
- 2008 E Laird Dr
- 1182 S Foothill Dr Unit 511
- 1170 S Foothill Dr Unit 311
- 1929 Laird Dr
- 2131 Logan Ave
- 2131 E Logan Ave
- 2115 Logan Ave
- 2137 Logan Ave S
- 2137 Logan Ave
- 1587 S 2100 E
- 1603 S 2100 E
- 1595 S 2100 E
- 1583 S 2100 E Unit 1585
- 2143 Logan Ave
- 2130 Logan Ave
- 2134 Logan Ave
- 1615 S 2100 E
- 2134 E Logan Ave
- 1575 S 2100 E
- 2138 Logan Ave
- 2151 Logan Ave
- 2141 Logan Ave
- 1631 S 2100 E
- 2122 Bryan Ave