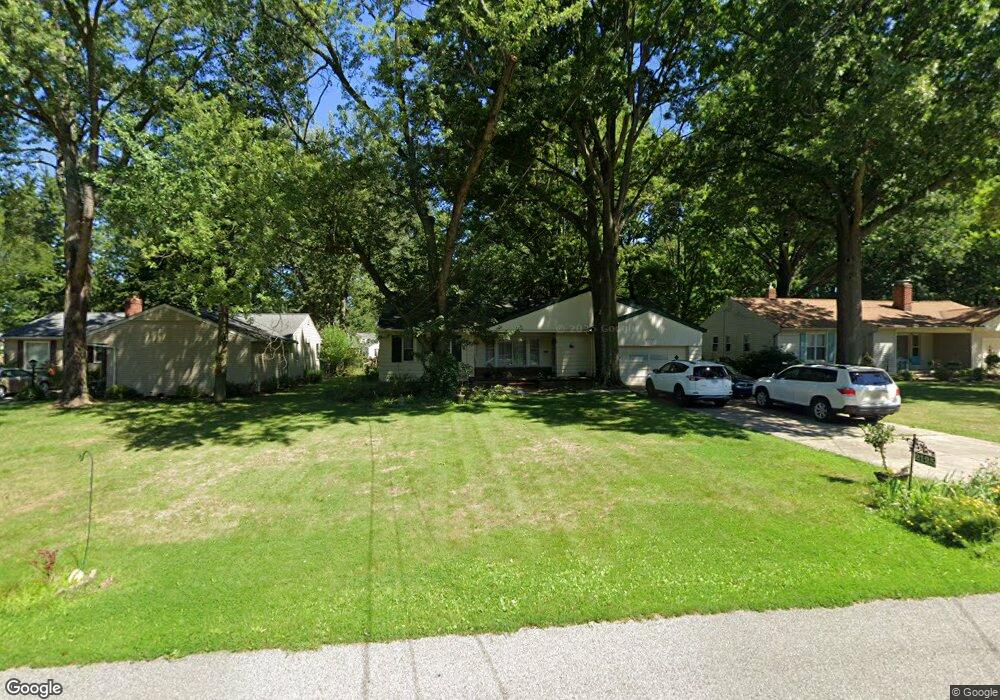
2125 Miami Rd Euclid, OH 44117
Estimated Value: $153,000 - $193,000
3
Beds
2
Baths
1,359
Sq Ft
$128/Sq Ft
Est. Value
About This Home
This home is located at 2125 Miami Rd, Euclid, OH 44117 and is currently estimated at $174,004, approximately $128 per square foot. 2125 Miami Rd is a home located in Cuyahoga County with nearby schools including Bluestone Elementary School, Euclid Middle School, and Euclid High School.
Ownership History
Date
Name
Owned For
Owner Type
Purchase Details
Closed on
Jan 14, 2000
Sold by
Haris Kimberly M and Watson Kimberly M
Bought by
Jeter Frederick and Jeter Margaret
Current Estimated Value
Home Financials for this Owner
Home Financials are based on the most recent Mortgage that was taken out on this home.
Original Mortgage
$102,850
Outstanding Balance
$41,249
Interest Rate
11.37%
Estimated Equity
$132,755
Purchase Details
Closed on
May 29, 1998
Sold by
Sabo Elmer A
Bought by
Harris Kimberly M
Home Financials for this Owner
Home Financials are based on the most recent Mortgage that was taken out on this home.
Original Mortgage
$105,419
Interest Rate
7.27%
Mortgage Type
FHA
Purchase Details
Closed on
Oct 26, 1992
Sold by
Sabo Elmer A and Sabo Hildegard
Bought by
Sabo Elmer A Trustee
Purchase Details
Closed on
Jan 1, 1975
Bought by
Sabo Elmer A and Sabo Hildegard
Create a Home Valuation Report for This Property
The Home Valuation Report is an in-depth analysis detailing your home's value as well as a comparison with similar homes in the area
Home Values in the Area
Average Home Value in this Area
Purchase History
| Date | Buyer | Sale Price | Title Company |
|---|---|---|---|
| Jeter Frederick | $121,000 | -- | |
| Harris Kimberly M | $105,500 | Executive Title Agency Corp | |
| Sabo Elmer A Trustee | -- | -- | |
| Sabo Elmer A | -- | -- |
Source: Public Records
Mortgage History
| Date | Status | Borrower | Loan Amount |
|---|---|---|---|
| Open | Jeter Frederick | $102,850 | |
| Closed | Harris Kimberly M | $105,419 |
Source: Public Records
Tax History Compared to Growth
Tax History
| Year | Tax Paid | Tax Assessment Tax Assessment Total Assessment is a certain percentage of the fair market value that is determined by local assessors to be the total taxable value of land and additions on the property. | Land | Improvement |
|---|---|---|---|---|
| 2024 | $3,592 | $52,325 | $12,215 | $40,110 |
| 2023 | $3,518 | $41,020 | $9,520 | $31,500 |
| 2022 | $3,437 | $41,020 | $9,520 | $31,500 |
| 2021 | $3,826 | $41,020 | $9,520 | $31,500 |
| 2020 | $3,209 | $31,080 | $7,210 | $23,870 |
| 2019 | $2,886 | $88,800 | $20,600 | $68,200 |
| 2018 | $2,912 | $31,080 | $7,210 | $23,870 |
| 2017 | $2,947 | $26,220 | $5,710 | $20,510 |
| 2016 | $2,954 | $26,220 | $5,710 | $20,510 |
| 2015 | $2,688 | $26,220 | $5,710 | $20,510 |
| 2014 | $2,688 | $26,220 | $5,710 | $20,510 |
Source: Public Records
Map
Nearby Homes
- 2441 Malden Rd
- 2536 Greenvale Rd
- 2150 Glenridge Rd
- 4002 Lancaster Rd
- 4031 Suffolk Rd
- 220 Greenvale Rd
- 237 Greenbriar Ct Unit F237
- 2337 Greenvale Rd
- 209 Greenbriar Ct
- 3803 Bridgeview Dr
- 24 Washington Square
- 3757 Princeton Blvd
- 565 Quilliams Rd
- 19871 Upper Valley Dr
- 2217 Belvoir Blvd
- 4188 Glenridge Rd
- 3790 Sherwood Rd
- 19201 Shawnee Rd
- 19201 Genesee Rd
- 4019 Princeton Blvd
- 2127 Miami Rd
- 2123 Miami Rd
- 2121 Miami Rd
- 2129 Miami Rd
- 2114 Algonquin Rd
- 2116 Algonquin Rd
- 2119 Miami Rd
- 2112 Algonquin Rd
- 2131 Miami Rd
- 2118 Algonquin Rd
- 2110 Algonquin Rd
- 2124 Miami Rd
- 2122 Miami Rd
- 2128 Miami Rd
- 2133 Miami Rd
- 2106 Algonquin Rd
- 2130 Miami Rd
- 2120 Miami Rd
- 2104 Algonquin Rd
- 2120 Algonquin Rd