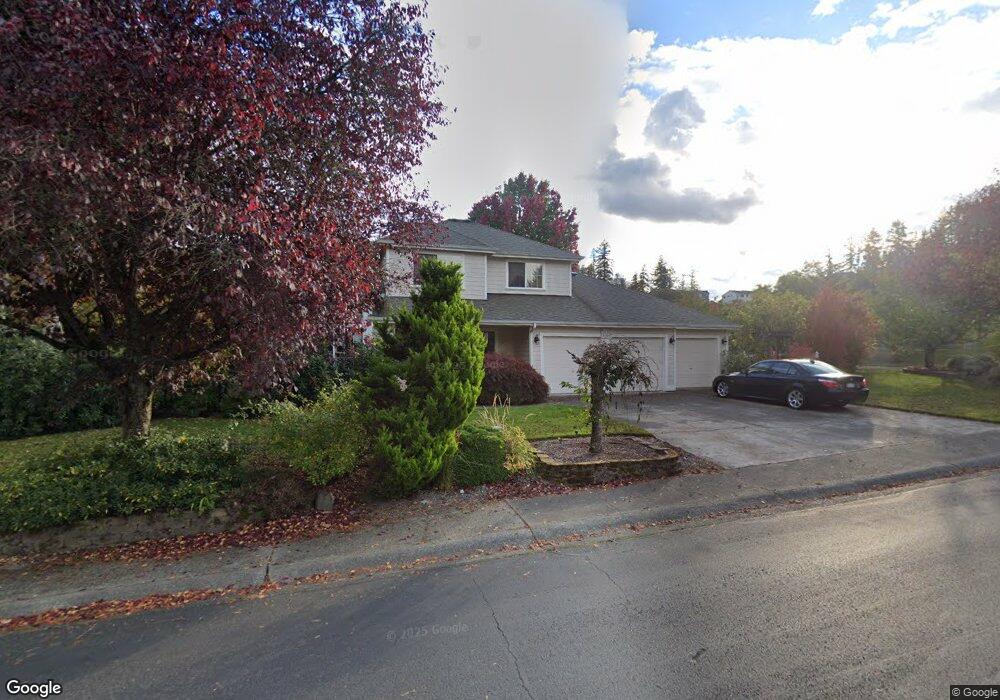
2125 NE Bjorn St Poulsbo, WA 98370
Estimated Value: $640,000 - $672,000
4
Beds
3
Baths
1,939
Sq Ft
$340/Sq Ft
Est. Value
About This Home
This home is located at 2125 NE Bjorn St, Poulsbo, WA 98370 and is currently estimated at $658,393, approximately $339 per square foot. 2125 NE Bjorn St is a home located in Kitsap County with nearby schools including Poulsbo Elementary School, Poulsbo Middle School, and North Kitsap High School.
Ownership History
Date
Name
Owned For
Owner Type
Purchase Details
Closed on
Apr 12, 2007
Sold by
Knight Annette A
Bought by
Mika Gale Jr Richard A and Mika Gale
Current Estimated Value
Home Financials for this Owner
Home Financials are based on the most recent Mortgage that was taken out on this home.
Original Mortgage
$288,000
Outstanding Balance
$173,653
Interest Rate
6.1%
Mortgage Type
Purchase Money Mortgage
Estimated Equity
$484,740
Purchase Details
Closed on
Oct 13, 2004
Sold by
Knight Brian P
Bought by
Knight Annette A
Purchase Details
Closed on
Jun 8, 1998
Sold by
Schneider Homes Inc
Bought by
Knight Brian P and Knight Annette
Home Financials for this Owner
Home Financials are based on the most recent Mortgage that was taken out on this home.
Original Mortgage
$167,300
Interest Rate
7.17%
Create a Home Valuation Report for This Property
The Home Valuation Report is an in-depth analysis detailing your home's value as well as a comparison with similar homes in the area
Home Values in the Area
Average Home Value in this Area
Purchase History
| Date | Buyer | Sale Price | Title Company |
|---|---|---|---|
| Mika Gale Jr Richard A | $360,280 | Transnation Title | |
| Knight Annette A | -- | -- | |
| Knight Brian P | $172,500 | Transnation Title Insurance |
Source: Public Records
Mortgage History
| Date | Status | Borrower | Loan Amount |
|---|---|---|---|
| Open | Mika Gale Jr Richard A | $288,000 | |
| Previous Owner | Knight Brian P | $167,300 |
Source: Public Records
Tax History Compared to Growth
Tax History
| Year | Tax Paid | Tax Assessment Tax Assessment Total Assessment is a certain percentage of the fair market value that is determined by local assessors to be the total taxable value of land and additions on the property. | Land | Improvement |
|---|---|---|---|---|
| 2026 | $5,085 | $566,690 | $118,310 | $448,380 |
| 2025 | $5,085 | $566,690 | $118,310 | $448,380 |
| 2024 | $4,675 | $536,410 | $110,640 | $425,770 |
| 2023 | $4,755 | $536,410 | $110,640 | $425,770 |
| 2022 | $4,216 | $452,220 | $96,040 | $356,180 |
| 2021 | $4,077 | $405,380 | $86,050 | $319,330 |
| 2020 | $3,964 | $387,210 | $82,210 | $305,000 |
| 2019 | $3,721 | $363,410 | $76,830 | $286,580 |
| 2018 | $3,454 | $286,590 | $58,370 | $228,220 |
| 2017 | $3,294 | $286,590 | $58,370 | $228,220 |
| 2016 | $3,372 | $270,290 | $58,370 | $211,920 |
| 2015 | $3,254 | $262,140 | $58,370 | $203,770 |
| 2014 | -- | $250,730 | $58,370 | $192,360 |
| 2013 | -- | $250,730 | $58,370 | $192,360 |
Source: Public Records
Map
Nearby Homes
- 2405 NE Waterlily Way
- 18130 Sunrise Ridge Ave NE
- 1610 NE Mount Kamela Ct
- 2413 NE Sunnymede St
- 2040 NE Norseman Way
- 2046 NE Norseman Way
- 17505 NE Midnight Sun Loop
- 2052 NE Norseman Way
- 2058 NE Norseman Way
- 2064 NE Norseman Way
- 18552 15th Loop NE
- 2019 NE Norseman Way
- 2072 NE Norseman Way
- Luna Plan at Liberty Bay Vista
- Rainier Plan at Liberty Bay Vista
- Bennett Plan at Liberty Bay Vista
- Bennett (Basement) Plan at Liberty Bay Vista
- Noah (Basement) Plan at Liberty Bay Vista
- Warren Plan at Liberty Bay Vista
- Raymond Plan at Liberty Bay Vista
- 2121 NE Lind Ct
- 2150 Miss Ellis Loop NE
- 2170 Miss Ellis Loop NE
- 2140 Miss Ellis Loop NE
- 2130 NE Bjorn St
- 2105 NE Lind Ct
- 2108 NE Bjorn St
- 2075 NE Bjorn St
- 2130 Miss Ellis Loop NE
- 2172 NE Gustaf St
- 2074 NE Bjorn St
- 2058 NE Lind Ct
- 2085 NE Lind Ct
- 2167 NE Gustaf St
- 2120 Miss Ellis Loop NE
- 2170 NE Gustaf St
- 2185 Miss Ellis Loop NE
- 2195 Miss Ellis Loop NE
- 2056 NE Bjorn St
- 2225 Miss Ellis Loop NE