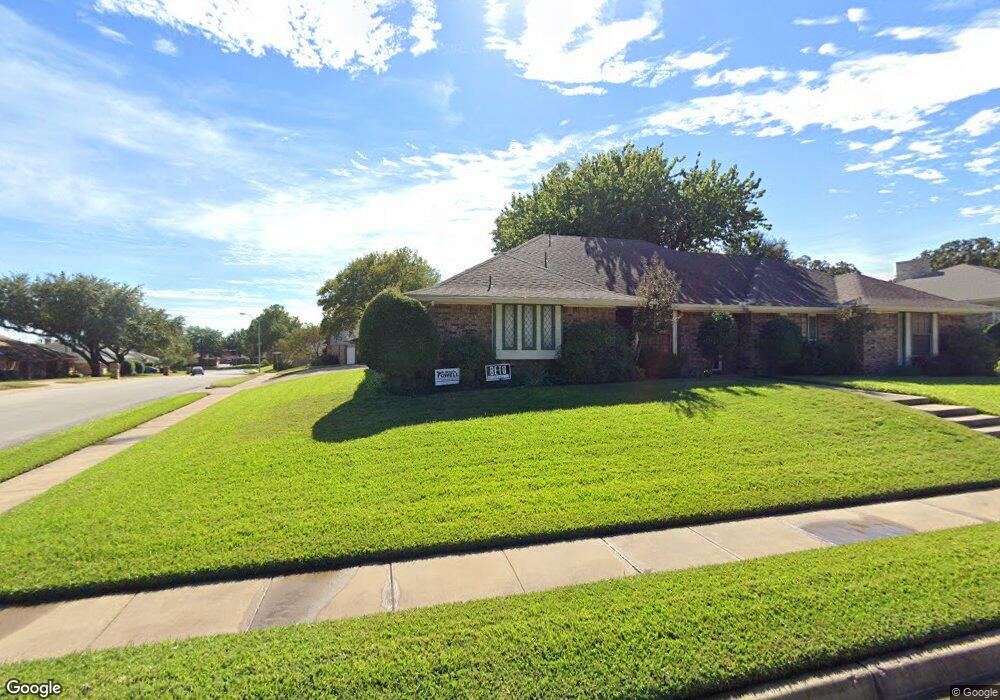
2125 Oakmeadow St Bedford, TX 76021
Estimated Value: $468,000
4
Beds
2
Baths
2,286
Sq Ft
$205/Sq Ft
Est. Value
About This Home
This home is located at 2125 Oakmeadow St, Bedford, TX 76021 and is currently estimated at $468,000, approximately $204 per square foot. 2125 Oakmeadow St is a home located in Tarrant County with nearby schools including Shady Brook Elementary School, Harwood Junior High School, and Trinity High School.
Ownership History
Date
Name
Owned For
Owner Type
Purchase Details
Closed on
May 22, 2017
Sold by
Glaszczak Karen and Glaszczak Richard
Bought by
Pasichnyk Pail and Pasichnyk Karen
Current Estimated Value
Home Financials for this Owner
Home Financials are based on the most recent Mortgage that was taken out on this home.
Original Mortgage
$260,110
Outstanding Balance
$215,014
Interest Rate
3.97%
Estimated Equity
$252,986
Purchase Details
Closed on
Jul 23, 2003
Sold by
Clegg Thomas D and Clegg Laura
Bought by
Glaszczak Richard L and Glaszczak Karen S
Home Financials for this Owner
Home Financials are based on the most recent Mortgage that was taken out on this home.
Original Mortgage
$154,000
Interest Rate
5.19%
Mortgage Type
Purchase Money Mortgage
Purchase Details
Closed on
Sep 27, 1994
Sold by
Tigert Toni and Burge Richard L
Bought by
Clegg Thomas D
Create a Home Valuation Report for This Property
The Home Valuation Report is an in-depth analysis detailing your home's value as well as a comparison with similar homes in the area
Home Values in the Area
Average Home Value in this Area
Purchase History
| Date | Buyer | Sale Price | Title Company |
|---|---|---|---|
| Pasichnyk Pail | -- | None Available | |
| Glaszczak Richard L | -- | American Title Co | |
| Clegg Thomas D | -- | American Title Company |
Source: Public Records
Mortgage History
| Date | Status | Borrower | Loan Amount |
|---|---|---|---|
| Open | Pasichnyk Pail | $260,110 | |
| Previous Owner | Glaszczak Richard L | $154,000 |
Source: Public Records
Tax History Compared to Growth
Tax History
| Year | Tax Paid | Tax Assessment Tax Assessment Total Assessment is a certain percentage of the fair market value that is determined by local assessors to be the total taxable value of land and additions on the property. | Land | Improvement |
|---|---|---|---|---|
| 2025 | $5,791 | $351,000 | $80,000 | $271,000 |
| 2024 | $5,791 | $371,616 | $80,000 | $291,616 |
| 2023 | $6,344 | $407,381 | $50,000 | $357,381 |
| 2022 | $6,568 | $300,695 | $50,000 | $250,695 |
| 2021 | $6,659 | $300,695 | $50,000 | $250,695 |
| 2020 | $6,110 | $257,000 | $50,000 | $207,000 |
| 2019 | $6,243 | $257,000 | $50,000 | $207,000 |
| 2018 | $5,661 | $248,744 | $50,000 | $198,744 |
| 2017 | $5,424 | $224,201 | $18,000 | $206,201 |
| 2016 | $5,138 | $212,371 | $18,000 | $194,371 |
| 2015 | $4,619 | $194,900 | $18,000 | $176,900 |
| 2014 | $4,619 | $194,900 | $18,000 | $176,900 |
Source: Public Records
Map
Nearby Homes
- 2109 Oakmeadow St
- 2112 Oakmeadow Place
- 2024 Oakmeadow St
- 22 Lincolnshire Cir
- 2417 Meadow Ct
- 2220 Tiffany Glenn Ct
- 2909 Oakridge Dr
- 1723 Post Oak Dr
- 1630 Post Oak Dr
- 1601 Warwickshire Ct W
- 37 Devonshire Dr
- 2524 Shady Ridge Dr
- 2516 Classic Ct W
- 2601 Murphy Dr
- 2501 Murphy Dr
- 2300 Folkstone Way
- 2503 Shady Ridge Dr
- 2521 Sanders Ct
- 2922 Beachtree Ln
- 1704 Indian Oaks Ct
- 2121 Oakmeadow St
- 2537 Glenoaks Ct
- 2533 Glenoaks Ct
- 2609 Glenoaks St
- 2600 Glenoaks St
- 2117 Oakmeadow St
- 2604 Glenoaks St
- 2516 Glenoaks St
- 2144 Oakmeadow St
- 2529 Glenoaks Ct
- 2608 Glenoaks St
- 2512 Glenoaks St
- 2613 Glenoaks St
- 2140 Oakmeadow St
- 2113 Oakmeadow St
- 2525 Glenoaks Ct
- 2505 Glenoaks Ct
- 2612 Glenoaks St
- 2136 Oakmeadow St
- 2508 Glenoaks St