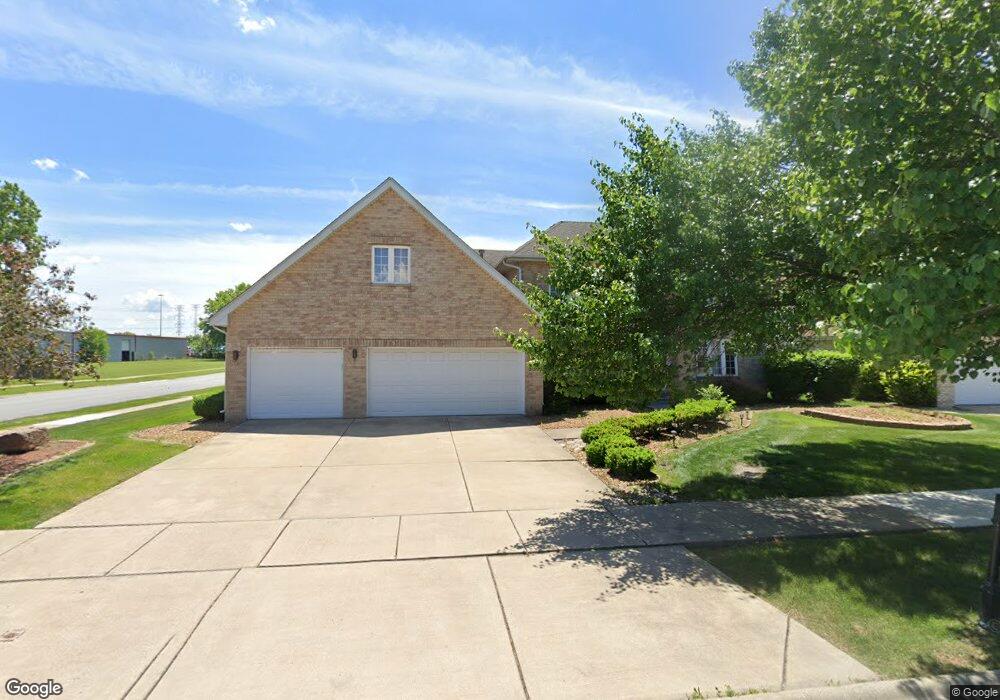
2125 Sunset Ln South Holland, IL 60473
Estimated Value: $304,000 - $412,000
4
Beds
3
Baths
2,405
Sq Ft
$150/Sq Ft
Est. Value
About This Home
This home is located at 2125 Sunset Ln, South Holland, IL 60473 and is currently estimated at $360,737, approximately $149 per square foot. 2125 Sunset Ln is a home located in Cook County with nearby schools including Greenwood Elementary School, Mckinley Elementary School, and Mckinley Jr High School.
Ownership History
Date
Name
Owned For
Owner Type
Purchase Details
Closed on
May 13, 2015
Sold by
Hines Anthony D
Bought by
Hines Wendy L
Current Estimated Value
Purchase Details
Closed on
Jan 29, 2009
Sold by
Us Bank National Association
Bought by
Hines Anthony and Hines Wendy
Home Financials for this Owner
Home Financials are based on the most recent Mortgage that was taken out on this home.
Original Mortgage
$210,900
Outstanding Balance
$133,172
Interest Rate
5.08%
Mortgage Type
Unknown
Estimated Equity
$227,565
Purchase Details
Closed on
May 23, 2007
Sold by
Harris William E
Bought by
Us Bank Na and First Franklin Mortgage Loan Trust 2006-
Purchase Details
Closed on
Dec 28, 2005
Sold by
Grant Michael
Bought by
Harris William E
Home Financials for this Owner
Home Financials are based on the most recent Mortgage that was taken out on this home.
Original Mortgage
$375,250
Interest Rate
8.25%
Mortgage Type
Fannie Mae Freddie Mac
Create a Home Valuation Report for This Property
The Home Valuation Report is an in-depth analysis detailing your home's value as well as a comparison with similar homes in the area
Home Values in the Area
Average Home Value in this Area
Purchase History
| Date | Buyer | Sale Price | Title Company |
|---|---|---|---|
| Hines Wendy L | -- | Ticor Title Insurance Co | |
| Hines Anthony | $222,000 | Multiple | |
| Us Bank Na | -- | None Available | |
| Harris William E | $395,000 | Pntn |
Source: Public Records
Mortgage History
| Date | Status | Borrower | Loan Amount |
|---|---|---|---|
| Open | Hines Anthony | $210,900 | |
| Previous Owner | Harris William E | $375,250 |
Source: Public Records
Tax History Compared to Growth
Tax History
| Year | Tax Paid | Tax Assessment Tax Assessment Total Assessment is a certain percentage of the fair market value that is determined by local assessors to be the total taxable value of land and additions on the property. | Land | Improvement |
|---|---|---|---|---|
| 2024 | $13,846 | $30,000 | $8,335 | $21,665 |
| 2023 | $11,782 | $30,000 | $8,335 | $21,665 |
| 2022 | $11,782 | $19,872 | $7,198 | $12,674 |
| 2021 | $11,318 | $19,872 | $7,198 | $12,674 |
| 2020 | $10,677 | $19,872 | $7,198 | $12,674 |
| 2019 | $11,269 | $20,539 | $6,061 | $14,478 |
| 2018 | $11,296 | $21,671 | $6,061 | $15,610 |
| 2017 | $11,043 | $21,671 | $6,061 | $15,610 |
| 2016 | $9,566 | $19,270 | $5,682 | $13,588 |
| 2015 | $9,259 | $19,270 | $5,682 | $13,588 |
| 2014 | $10,148 | $21,658 | $5,682 | $15,976 |
| 2013 | -- | $22,485 | $5,682 | $16,803 |
Source: Public Records
Map
Nearby Homes
- 2155 Bernice Rd
- 2005 Fairview Ln
- 2024 E 171st Ct
- 2237 175th St Unit 1B
- 2237 175th St Unit 2B
- 2304 Holiday Terrace Unit 503
- 17048 Clyde Ave
- 2306 Holiday Terrace Unit 149
- 2306 Holiday Terrace Unit 163
- 2306 Holiday Terrace Unit 146
- 1970 E 170th St
- 16909 Paxton Ave
- 2216 177th St
- 2307 177th St
- 16822 Merrill Ave
- 16747 Paxton Ave
- 17871 Locust St
- 1991 Indiana Ave
- 17934 Locust St
- 17700 Escanaba Ave
- 2115 Sunset Ln
- 2145 Sunset Ln
- 2105 Sunset Ln
- 2110 Fairview Ln
- 2100 Fairview Ln
- 2130 Sunset Ln
- 2140 Sunset Ln
- 17260 Heritage Dr
- 2090 Fairview Ln
- 2120 Sunset Ln Unit 3
- 2155 Sunset Ln
- 2095 Sunset Ln
- 2080 Fairview Ln
- 2110 Sunset Ln
- 17250 Heritage Dr
- 2085 Sunset Ln
- 17287 Heritage Dr
- 2125 Parkview Dr
- 2135 Parkview Dr
- 2070 Fairview Ln