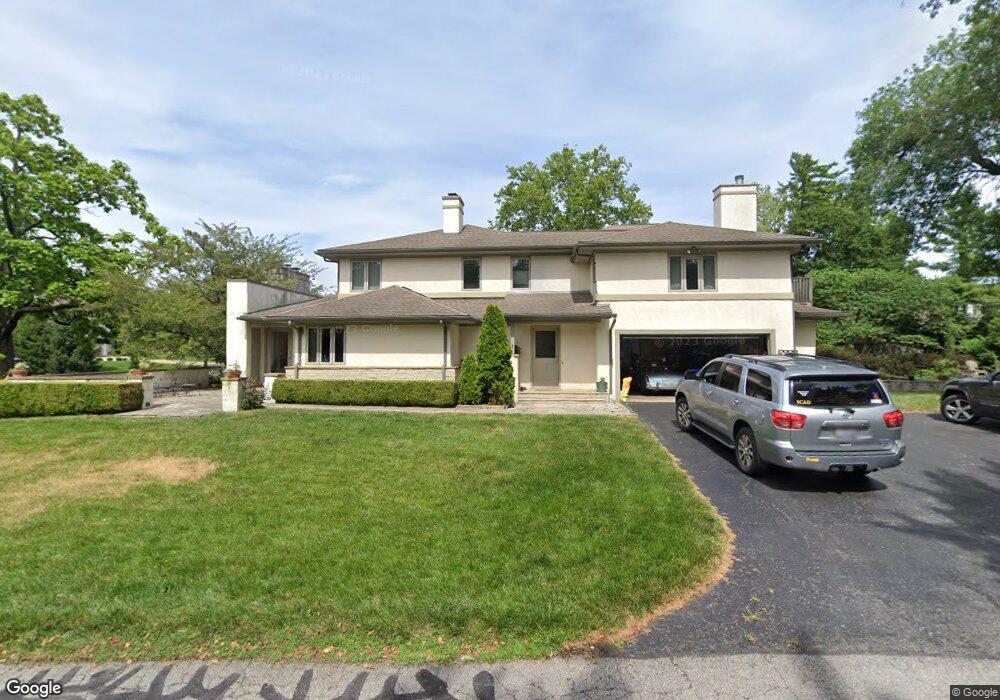
2125 Waltham Rd Columbus, OH 43221
Estimated Value: $1,215,000 - $1,492,000
4
Beds
5
Baths
2,854
Sq Ft
$482/Sq Ft
Est. Value
About This Home
This home is located at 2125 Waltham Rd, Columbus, OH 43221 and is currently estimated at $1,374,788, approximately $481 per square foot. 2125 Waltham Rd is a home located in Franklin County with nearby schools including Barrington Road Elementary School, Jones Middle School, and Upper Arlington High School.
Ownership History
Date
Name
Owned For
Owner Type
Purchase Details
Closed on
Aug 30, 2002
Sold by
Shank Douglas K and Shank Amy B
Bought by
Tingley Paul M and Tingley Stephanie B Hanks
Current Estimated Value
Home Financials for this Owner
Home Financials are based on the most recent Mortgage that was taken out on this home.
Original Mortgage
$376,000
Outstanding Balance
$135,566
Interest Rate
4.37%
Mortgage Type
Purchase Money Mortgage
Estimated Equity
$1,239,222
Purchase Details
Closed on
May 22, 2000
Sold by
Mount John T Trustee
Bought by
Shank Douglas K and Buschar Shank Amy B
Home Financials for this Owner
Home Financials are based on the most recent Mortgage that was taken out on this home.
Original Mortgage
$324,000
Interest Rate
8.12%
Purchase Details
Closed on
Feb 15, 1994
Bought by
Mount John T Tr
Create a Home Valuation Report for This Property
The Home Valuation Report is an in-depth analysis detailing your home's value as well as a comparison with similar homes in the area
Home Values in the Area
Average Home Value in this Area
Purchase History
| Date | Buyer | Sale Price | Title Company |
|---|---|---|---|
| Tingley Paul M | $470,000 | Chicago Title | |
| Shank Douglas K | $405,000 | Chicago Title | |
| Mount John T Tr | -- | -- |
Source: Public Records
Mortgage History
| Date | Status | Borrower | Loan Amount |
|---|---|---|---|
| Open | Tingley Paul M | $376,000 | |
| Closed | Shank Douglas K | $324,000 |
Source: Public Records
Tax History Compared to Growth
Tax History
| Year | Tax Paid | Tax Assessment Tax Assessment Total Assessment is a certain percentage of the fair market value that is determined by local assessors to be the total taxable value of land and additions on the property. | Land | Improvement |
|---|---|---|---|---|
| 2024 | $22,119 | $382,070 | $149,000 | $233,070 |
| 2023 | $21,845 | $382,070 | $149,000 | $233,070 |
| 2022 | $21,501 | $307,690 | $98,280 | $209,410 |
| 2021 | $19,033 | $307,690 | $98,280 | $209,410 |
| 2020 | $18,864 | $307,690 | $98,280 | $209,410 |
| 2019 | $18,836 | $271,640 | $98,280 | $173,360 |
| 2018 | $16,934 | $271,640 | $98,280 | $173,360 |
| 2017 | $16,971 | $271,640 | $98,280 | $173,360 |
| 2016 | $15,151 | $227,650 | $73,260 | $154,390 |
| 2015 | $15,138 | $227,650 | $73,260 | $154,390 |
| 2014 | $15,056 | $227,650 | $73,260 | $154,390 |
| 2013 | $7,239 | $206,955 | $66,605 | $140,350 |
Source: Public Records
Map
Nearby Homes
- 1631 Roxbury Rd Unit F3
- 1631 Roxbury Rd Unit B6
- 2015 W 5th Ave Unit 211
- 2015 W 5th Ave Unit 102
- 2015 W 5th Ave Unit 108
- 1782 Wyandotte Rd
- 2063 Westover Rd
- 1869 Tewksbury Rd
- 2110 Northwest Blvd
- 1561 Glenn Ave
- 1733 Elmwood Ave
- 2170 Lane Woods Dr Unit 2170
- 1914 Elmwood Ave
- 2704 Scioto Station Dr Unit 2704
- 1661 Ashland Ave Unit 663
- 2754 Scioto Station Dr
- 1459 Elmwood Ave Unit 1459
- 1301 Lake Shore Dr Unit 199
- 1313 Lincoln Rd
- 2583 Wexford Rd
- 2115 Waltham Rd
- 1945 Cambridge Blvd
- 1954 Upper Chelsea Rd
- 2094 Edgemont Rd
- 2155 Waltham Rd
- 1901 Upper Chelsea Rd
- 1971 Cambridge Blvd
- 1955 Upper Chelsea Rd
- 2150 Waltham Rd
- 1919 Cambridge Blvd
- 1970 Upper Chelsea Rd
- 0 Upper Chelsea Rd
- 1911 Upper Chelsea Rd
- 1586 Yorkshire Rd
- 2171 Waltham Rd
- 1965 Upper Chelsea Rd
- 1981 Cambridge Blvd
- 2170 Waltham Rd
- 0 Cambridge Blvd
- 1950 Cambridge Blvd