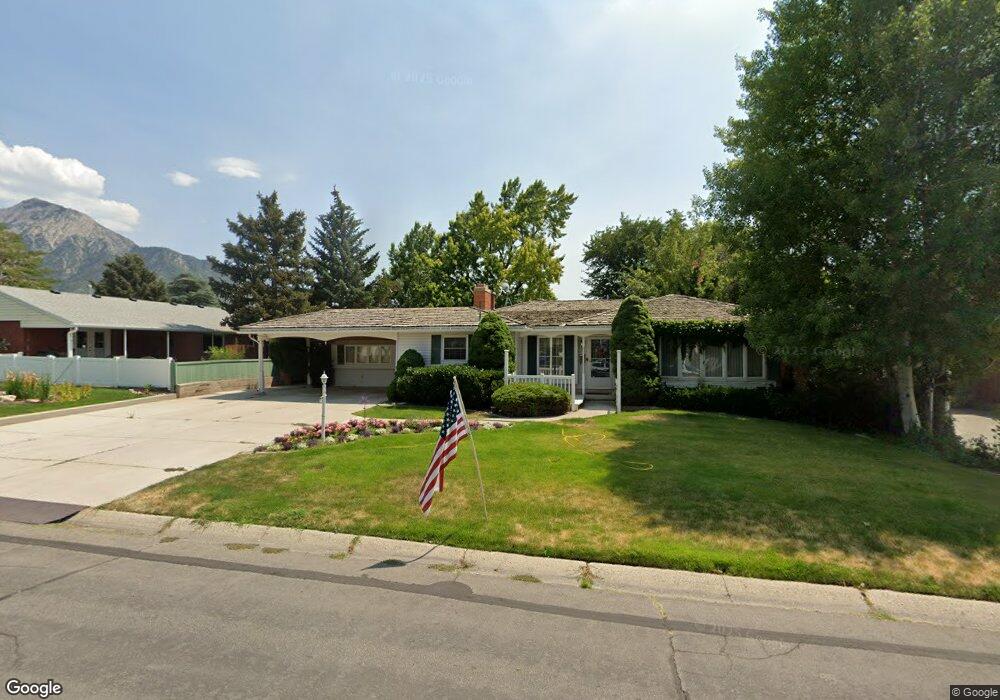
2126 E 3715 S Salt Lake City, UT 84109
East Millcreek NeighborhoodEstimated Value: $867,000 - $1,104,000
5
Beds
4
Baths
2,443
Sq Ft
$397/Sq Ft
Est. Value
About This Home
This home is located at 2126 E 3715 S, Salt Lake City, UT 84109 and is currently estimated at $970,778, approximately $397 per square foot. 2126 E 3715 S is a home located in Salt Lake County with nearby schools including William Penn Elementary School, Evergreen Junior High School, and Olympus High School.
Ownership History
Date
Name
Owned For
Owner Type
Purchase Details
Closed on
May 30, 2017
Sold by
Petersen Stanford B
Bought by
Petersen Stanford B
Current Estimated Value
Purchase Details
Closed on
Apr 25, 2016
Sold by
Petersen Stanford B and Peterson Stanford
Bought by
Petersen Stanford B
Purchase Details
Closed on
Oct 2, 1998
Sold by
Petersen Stanford B and Petersen Carol
Bought by
Petersen Carol J and Carol J Petersen Trust
Create a Home Valuation Report for This Property
The Home Valuation Report is an in-depth analysis detailing your home's value as well as a comparison with similar homes in the area
Home Values in the Area
Average Home Value in this Area
Purchase History
| Date | Buyer | Sale Price | Title Company |
|---|---|---|---|
| Petersen Stanford B | -- | Accommodation | |
| Petersen Stanford B | -- | Richland Title Ins Agency In | |
| Petersen Stanford B | -- | Richland Title Ins Agency In | |
| Petersen Carol J | -- | -- |
Source: Public Records
Tax History Compared to Growth
Tax History
| Year | Tax Paid | Tax Assessment Tax Assessment Total Assessment is a certain percentage of the fair market value that is determined by local assessors to be the total taxable value of land and additions on the property. | Land | Improvement |
|---|---|---|---|---|
| 2025 | $4,125 | $724,900 | $329,200 | $395,700 |
| 2024 | $4,125 | $660,400 | $319,000 | $341,400 |
| 2023 | $3,962 | $612,300 | $268,000 | $344,300 |
| 2022 | $3,997 | $620,900 | $262,800 | $358,100 |
| 2021 | $3,685 | $496,400 | $178,700 | $317,700 |
| 2020 | $3,610 | $458,900 | $168,200 | $290,700 |
| 2019 | $3,448 | $428,200 | $154,900 | $273,300 |
| 2018 | $3,384 | $404,700 | $154,900 | $249,800 |
| 2017 | $3,183 | $398,800 | $154,900 | $243,900 |
| 2016 | $2,690 | $340,300 | $154,900 | $185,400 |
| 2015 | $2,387 | $282,700 | $173,500 | $109,200 |
| 2014 | $2,197 | $254,500 | $165,800 | $88,700 |
Source: Public Records
Map
Nearby Homes
- 2311 E Delia Dr
- 3838 S 1950 E
- 3985 Arco Cir
- 3995 S 2280 E
- 1977 E Millbrook Dr
- 2341 E Neffs Ln
- 1870 E 3900 S
- 3404 S 2130 E
- 3916 Olympus Orchards Ln
- 1839 E Honeybrook Place
- 2272 E 3380 S
- 1772 E Countryside Dr
- 2525 E Hillside Cir
- 2346 E 3395 S
- 2070 E 3335 S Unit 13
- 1818 E 3900 S
- 1801 E 3900 S
- 2087 Lincoln Ln
- 2129 E Georgetown Square
- 3983 S Mercury Dr