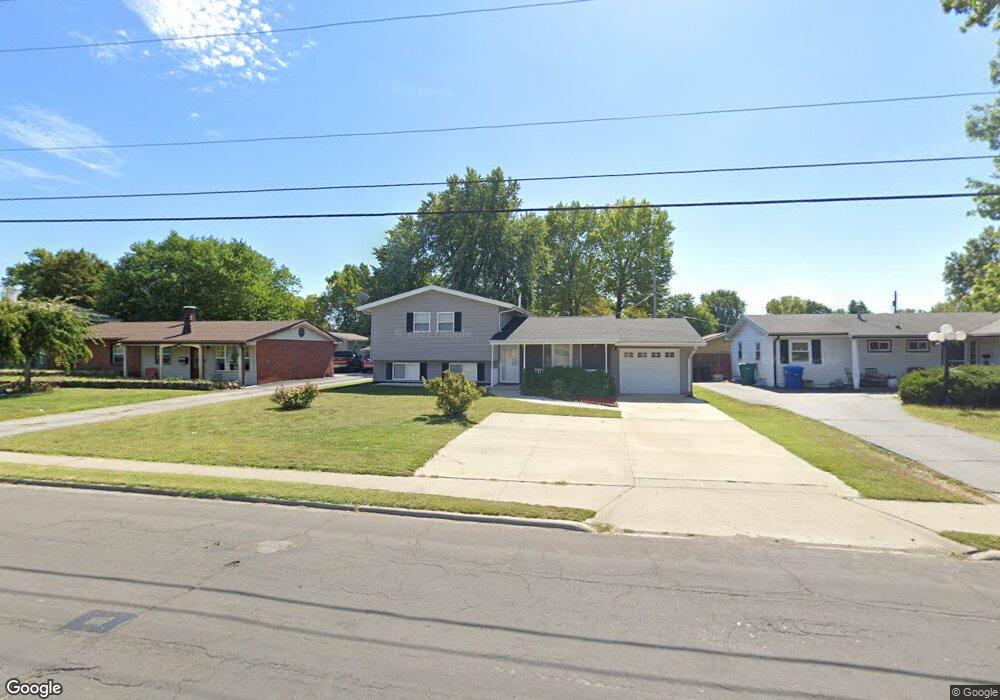
2126 Johnson Rd Granite City, IL 62040
Estimated Value: $108,106 - $201,000
3
Beds
1
Bath
594
Sq Ft
$232/Sq Ft
Est. Value
About This Home
This home is located at 2126 Johnson Rd, Granite City, IL 62040 and is currently estimated at $138,027, approximately $232 per square foot. 2126 Johnson Rd is a home located in Madison County with nearby schools including Granite City High School, Metro East Montessori School, and St. Elizabeth Elementary School.
Ownership History
Date
Name
Owned For
Owner Type
Purchase Details
Closed on
Feb 28, 2014
Sold by
Wright Price Properties Llc
Bought by
Hall John W and Hall Raja K
Current Estimated Value
Home Financials for this Owner
Home Financials are based on the most recent Mortgage that was taken out on this home.
Original Mortgage
$93,100
Outstanding Balance
$70,860
Interest Rate
4.45%
Mortgage Type
New Conventional
Estimated Equity
$67,167
Purchase Details
Closed on
May 20, 2013
Sold by
County Of Madison
Bought by
Wright-Price Properties Llc
Create a Home Valuation Report for This Property
The Home Valuation Report is an in-depth analysis detailing your home's value as well as a comparison with similar homes in the area
Home Values in the Area
Average Home Value in this Area
Purchase History
| Date | Buyer | Sale Price | Title Company |
|---|---|---|---|
| Hall John W | $98,500 | Metro Title & Escrow Company | |
| Wright-Price Properties Llc | -- | None Available |
Source: Public Records
Mortgage History
| Date | Status | Borrower | Loan Amount |
|---|---|---|---|
| Open | Hall John W | $93,100 |
Source: Public Records
Tax History Compared to Growth
Tax History
| Year | Tax Paid | Tax Assessment Tax Assessment Total Assessment is a certain percentage of the fair market value that is determined by local assessors to be the total taxable value of land and additions on the property. | Land | Improvement |
|---|---|---|---|---|
| 2024 | $2,320 | $37,620 | $6,500 | $31,120 |
| 2023 | $2,320 | $33,910 | $5,860 | $28,050 |
| 2022 | $2,182 | $31,070 | $5,370 | $25,700 |
| 2021 | $1,876 | $29,140 | $5,040 | $24,100 |
| 2020 | $1,780 | $27,830 | $4,810 | $23,020 |
| 2019 | $1,667 | $26,380 | $4,560 | $21,820 |
| 2018 | $1,592 | $25,610 | $4,430 | $21,180 |
| 2017 | $2,095 | $26,550 | $4,590 | $21,960 |
| 2016 | $2,160 | $26,550 | $4,590 | $21,960 |
| 2015 | $1,947 | $26,550 | $4,590 | $21,960 |
| 2014 | $1,947 | $26,550 | $4,590 | $21,960 |
| 2013 | $1,947 | $26,550 | $4,590 | $21,960 |
Source: Public Records
Map
Nearby Homes
- 2130 Johnson Rd
- 2122 Johnson Rd
- 5 Frontenac Ln
- 2134 Johnson Rd
- 2118 Johnson Rd
- 7 Frontenac Ln
- 3 Frontenac Ln
- 9 Frontenac Ln
- 1 Frontenac Ln
- 2138 Johnson Rd
- 3278 Westchester Dr
- 11 Frontenac Ln
- 3274 Westchester Dr
- 2142 Johnson Rd
- 6 Frontenac Ln
- 3279 Franklin Ave
- 8 Frontenac Ln
- 4 Frontenac Ln
- 13 Frontenac Ln
- 3301 Franklin Ave