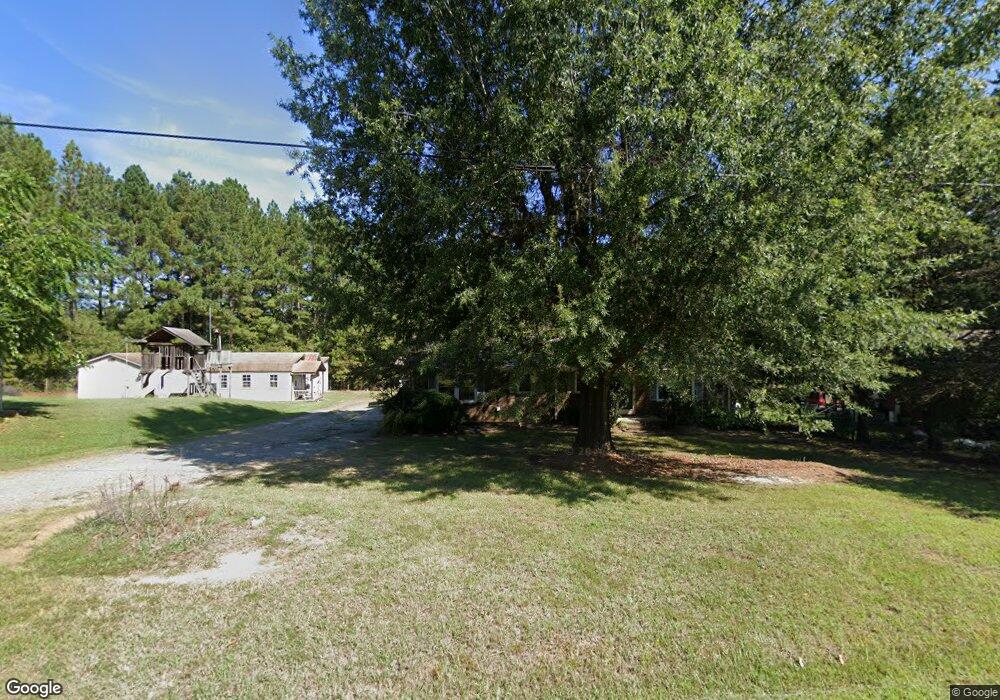
2126 Lower Hopedale Rd Burlington, NC 27217
North Burlington NeighborhoodEstimated Value: $192,000 - $236,000
2
Beds
1
Bath
1,250
Sq Ft
$164/Sq Ft
Est. Value
About This Home
This home is located at 2126 Lower Hopedale Rd, Burlington, NC 27217 and is currently estimated at $205,257, approximately $164 per square foot. 2126 Lower Hopedale Rd is a home located in Alamance County with nearby schools including Pleasant Grove Elementary School, Western Alamance Middle School, and Western Alamance High School.
Ownership History
Date
Name
Owned For
Owner Type
Purchase Details
Closed on
Jan 12, 2023
Sold by
Perry Alton M and Perry Dianne C
Bought by
Perry Kameron Lynn
Current Estimated Value
Create a Home Valuation Report for This Property
The Home Valuation Report is an in-depth analysis detailing your home's value as well as a comparison with similar homes in the area
Home Values in the Area
Average Home Value in this Area
Purchase History
| Date | Buyer | Sale Price | Title Company |
|---|---|---|---|
| Perry Kameron Lynn | -- | -- | |
| Perry Kameron Lynn | -- | None Listed On Document |
Source: Public Records
Tax History Compared to Growth
Tax History
| Year | Tax Paid | Tax Assessment Tax Assessment Total Assessment is a certain percentage of the fair market value that is determined by local assessors to be the total taxable value of land and additions on the property. | Land | Improvement |
|---|---|---|---|---|
| 2025 | $1,098 | $188,006 | $22,000 | $166,006 |
| 2024 | $1,032 | $188,006 | $22,000 | $166,006 |
| 2023 | $958 | $188,006 | $22,000 | $166,006 |
| 2022 | $645 | $84,127 | $15,000 | $69,127 |
| 2021 | $653 | $84,127 | $15,000 | $69,127 |
| 2020 | $661 | $84,127 | $15,000 | $69,127 |
| 2019 | $656 | $84,127 | $15,000 | $69,127 |
| 2018 | $0 | $84,127 | $15,000 | $69,127 |
| 2017 | $578 | $84,127 | $15,000 | $69,127 |
| 2016 | $588 | $85,168 | $17,875 | $67,293 |
| 2015 | $570 | $85,168 | $17,875 | $67,293 |
| 2014 | -- | $89,865 | $17,875 | $71,990 |
Source: Public Records
Map
Nearby Homes
- 2116 Carolina Rd
- 129 Carriage Loop
- 737 Grover Ln
- 109 W Old Glencoe Rd
- 1852 N Carolina 62
- 2022 N Carolina 62
- 1436 Lanier Ct
- 123 W Old Glencoe Rd
- 2032 N Carolina 62
- 1812 N Nc Highway 62
- 141 Saige Ct
- 129 W Old Glencoe Rd
- 137 W Old Glencoe Rd
- 1007 Pinnix Rd
- 1008 Pinnix Rd
- 1007 Pinnix Loop
- 1008 Pinnix Loop
- 1016 Pinnix Loop
- 1015 Pinnix Loop
- 1022 Pinnix Loop
- 2128 Lower Hopedale Rd
- 2120 Lower Hopedale Rd
- 2119 Lower Hopedale Rd
- 2125 Lower Hopedale Rd
- 2117 Lower Hopedale Rd
- 2138 Lower Hopedale Rd
- 2133 Lower Hopedale Rd
- 2137 Lower Hopedale Rd
- 2113 Lower Hopedale Rd
- 2141 Lower Hopedale Rd
- 2116 Lower Hopedale Rd
- 2145 Lower Hopedale Rd
- 2127 Oakley Farm Rd
- 2109 Lower Hopedale Rd
- 2147 Lower Hopedale Rd
- 1949 Dixon Swimming Pool Rd
- 1941 Dixon Swimming Pool Rd
- 2151 Lower Hopedale Rd
- 1966 Dixon Swimming Pool Rd
- 1933 Dixon Swimming Pool Rd