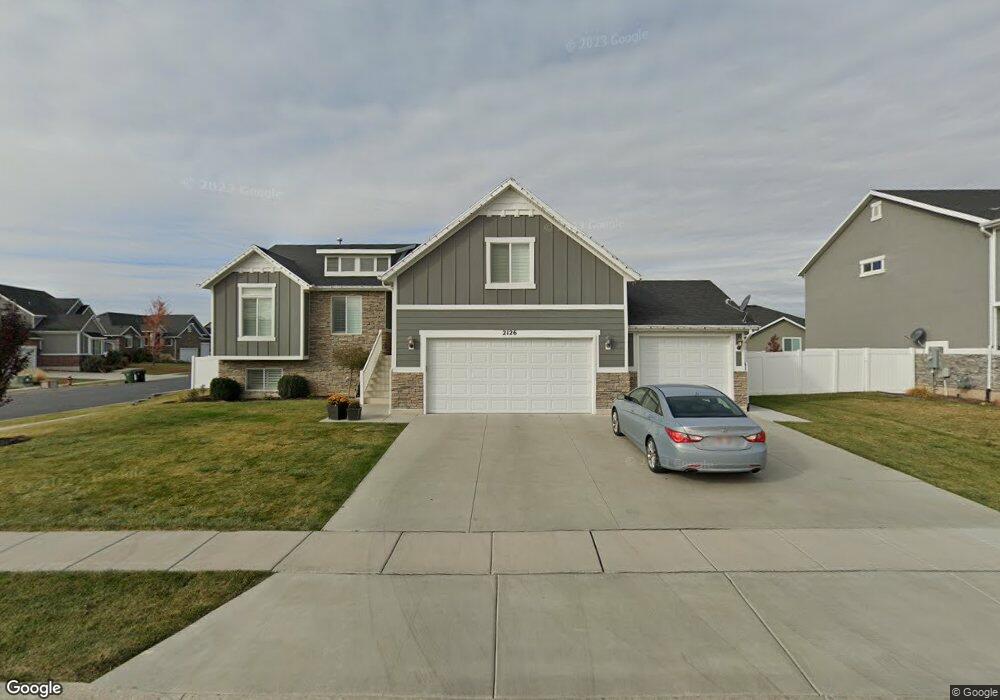
2126 S 1070 W Syracuse, UT 84075
Estimated Value: $650,000 - $682,275
5
Beds
3
Baths
3,196
Sq Ft
$209/Sq Ft
Est. Value
About This Home
This home is located at 2126 S 1070 W, Syracuse, UT 84075 and is currently estimated at $668,569, approximately $209 per square foot. 2126 S 1070 W is a home located in Davis County with nearby schools including Bluff Ridge Elementary, Legacy Junior High School, and Clearfield High School.
Ownership History
Date
Name
Owned For
Owner Type
Purchase Details
Closed on
May 20, 2022
Sold by
Israelsen and Kellie-Jo
Bought by
Urry Robin Scott and Urry Kasana Milika
Current Estimated Value
Home Financials for this Owner
Home Financials are based on the most recent Mortgage that was taken out on this home.
Original Mortgage
$450,000
Outstanding Balance
$427,490
Interest Rate
5.25%
Mortgage Type
New Conventional
Estimated Equity
$241,079
Purchase Details
Closed on
Jul 16, 2019
Sold by
Johnson Aaron and Johnson Nicole
Bought by
Israelsen Mark and Israelsen Kellie Jo
Home Financials for this Owner
Home Financials are based on the most recent Mortgage that was taken out on this home.
Original Mortgage
$369,750
Interest Rate
3.9%
Mortgage Type
New Conventional
Purchase Details
Closed on
Feb 3, 2015
Sold by
Thr Investments Llc
Bought by
Rhoades Michael and Rhoades Charlotte
Create a Home Valuation Report for This Property
The Home Valuation Report is an in-depth analysis detailing your home's value as well as a comparison with similar homes in the area
Home Values in the Area
Average Home Value in this Area
Purchase History
| Date | Buyer | Sale Price | Title Company |
|---|---|---|---|
| Urry Robin Scott | -- | None Listed On Document | |
| Israelsen Mark | -- | Rudd & Hawkes Ttl Ins Agcy L | |
| Rhoades Michael | -- | None Available |
Source: Public Records
Mortgage History
| Date | Status | Borrower | Loan Amount |
|---|---|---|---|
| Open | Urry Robin Scott | $450,000 | |
| Previous Owner | Israelsen Mark | $369,750 |
Source: Public Records
Tax History Compared to Growth
Tax History
| Year | Tax Paid | Tax Assessment Tax Assessment Total Assessment is a certain percentage of the fair market value that is determined by local assessors to be the total taxable value of land and additions on the property. | Land | Improvement |
|---|---|---|---|---|
| 2025 | $3,556 | $364,650 | $116,101 | $248,549 |
| 2024 | $3,556 | $345,401 | $93,594 | $251,807 |
| 2023 | $3,345 | $592,000 | $130,549 | $461,451 |
| 2022 | $3,174 | $308,000 | $75,480 | $232,520 |
| 2021 | $299 | $423,000 | $111,268 | $311,732 |
| 2020 | $2,517 | $366,000 | $98,143 | $267,857 |
| 2019 | $2,584 | $371,000 | $94,446 | $276,554 |
| 2018 | $2,435 | $347,000 | $92,009 | $254,991 |
| 2016 | $1,988 | $148,555 | $30,535 | $118,020 |
Source: Public Records
Map
Nearby Homes