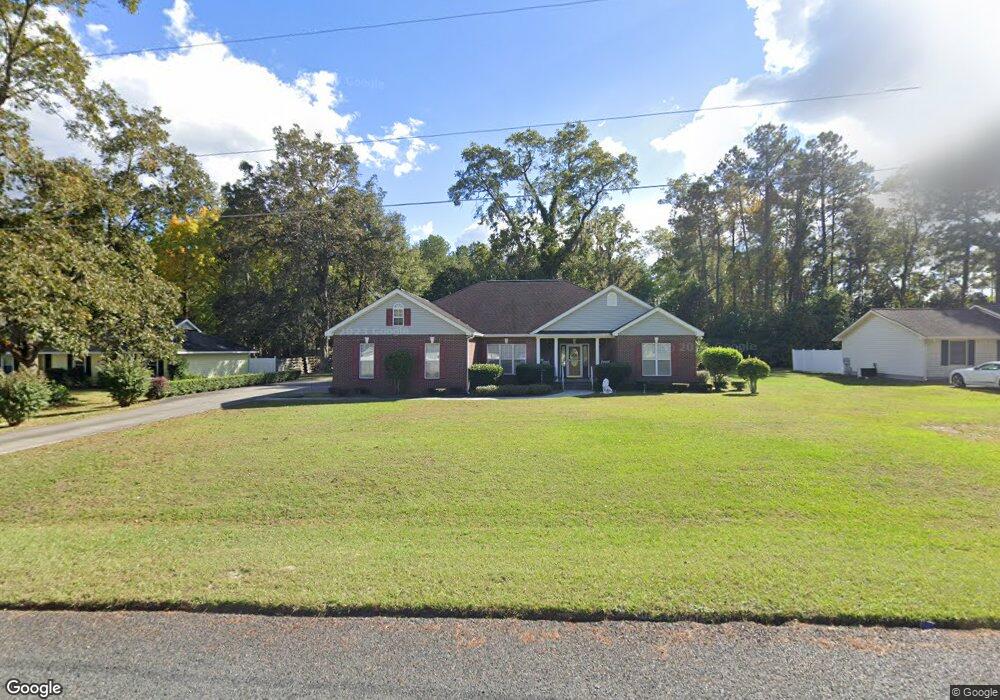
2126 Shawnee Dr Waycross, GA 31501
Estimated Value: $293,000 - $358,000
3
Beds
3
Baths
2,356
Sq Ft
$136/Sq Ft
Est. Value
About This Home
This home is located at 2126 Shawnee Dr, Waycross, GA 31501 and is currently estimated at $320,717, approximately $136 per square foot. 2126 Shawnee Dr is a home located in Ware County with nearby schools including Williams Heights Elementary School, Waycross Middle School, and Ware County High School.
Ownership History
Date
Name
Owned For
Owner Type
Purchase Details
Closed on
Oct 28, 2024
Sold by
Carter Edna B
Bought by
Carter Bradley Leon and Carter Edna B
Current Estimated Value
Home Financials for this Owner
Home Financials are based on the most recent Mortgage that was taken out on this home.
Original Mortgage
$269,655
Outstanding Balance
$266,672
Interest Rate
6.08%
Mortgage Type
New Conventional
Estimated Equity
$54,045
Purchase Details
Closed on
Jun 10, 1999
Sold by
Cayman Builders Inc
Bought by
Carter Edna B
Purchase Details
Closed on
May 13, 1999
Sold by
Mitchell Whaley Rigg
Bought by
Cayman Builders Inc
Purchase Details
Closed on
Oct 4, 1990
Bought by
Mitchell Whaley Rigg
Create a Home Valuation Report for This Property
The Home Valuation Report is an in-depth analysis detailing your home's value as well as a comparison with similar homes in the area
Home Values in the Area
Average Home Value in this Area
Purchase History
| Date | Buyer | Sale Price | Title Company |
|---|---|---|---|
| Carter Bradley Leon | -- | -- | |
| Carter Edna B | $13,800 | -- | |
| Cayman Builders Inc | $10,000 | -- | |
| Mitchell Whaley Rigg | $10,000 | -- |
Source: Public Records
Mortgage History
| Date | Status | Borrower | Loan Amount |
|---|---|---|---|
| Open | Carter Bradley Leon | $269,655 |
Source: Public Records
Tax History Compared to Growth
Tax History
| Year | Tax Paid | Tax Assessment Tax Assessment Total Assessment is a certain percentage of the fair market value that is determined by local assessors to be the total taxable value of land and additions on the property. | Land | Improvement |
|---|---|---|---|---|
| 2024 | $1,595 | $133,586 | $7,990 | $125,596 |
| 2023 | $1,627 | $104,600 | $9,870 | $94,730 |
| 2022 | $1,807 | $104,600 | $9,870 | $94,730 |
| 2021 | $1,912 | $84,374 | $9,870 | $74,504 |
| 2020 | $1,933 | $79,717 | $9,870 | $69,847 |
| 2019 | $1,820 | $58,763 | $9,870 | $48,893 |
| 2018 | $1,794 | $56,958 | $9,870 | $47,088 |
| 2017 | $1,792 | $56,958 | $9,870 | $47,088 |
| 2016 | $1,792 | $56,958 | $9,870 | $47,088 |
| 2015 | $1,858 | $59,088 | $12,000 | $47,088 |
| 2014 | $1,856 | $59,088 | $12,000 | $47,088 |
| 2013 | -- | $67,756 | $12,000 | $55,756 |
Source: Public Records
Map
Nearby Homes
- 914 Barkley St
- 1312 Atlantic Ave
- 955 Lynn Dr
- 807 City Blvd
- 1204 Richmond Ave
- 1049 Riverdale Dr
- 1504 Danora Dr
- 1502 Seminole Trail
- 7438 Central Ave
- 723 St Bernard Trail
- 1100 Atlantic Ave
- 1002 Baltimore Ave
- 2775 Seminole Trail
- 1205 Dean Dr
- 1100 Euclid Ave
- 00 Seminole Trail
- 1400 E Cherokee Dr
- 1009 Euclid Ave
- 867 Kentland Dr
- 1617 Moss Creek Rd
- 2130 Shawnee Dr
- 2169 Central Ave
- 2120 Shawnee Dr
- 910 Barkley St
- 2140 Shawnee Dr
- 2135 Shawnee Dr
- 909 Barkley St
- 2185 Central Ave
- 2150 Shawnee Dr
- 913 Barkley St
- 913 Carrie Dr
- 2130 Woodruff Ct
- 915 Carrie Dr
- 915 Barkley St
- 2140 Woodruff Ct
- 920 Barkley St
- 2125 Woodruff Ct
- 8511 Central Ave
- 00 Central Ave
- 3126 Central Ave