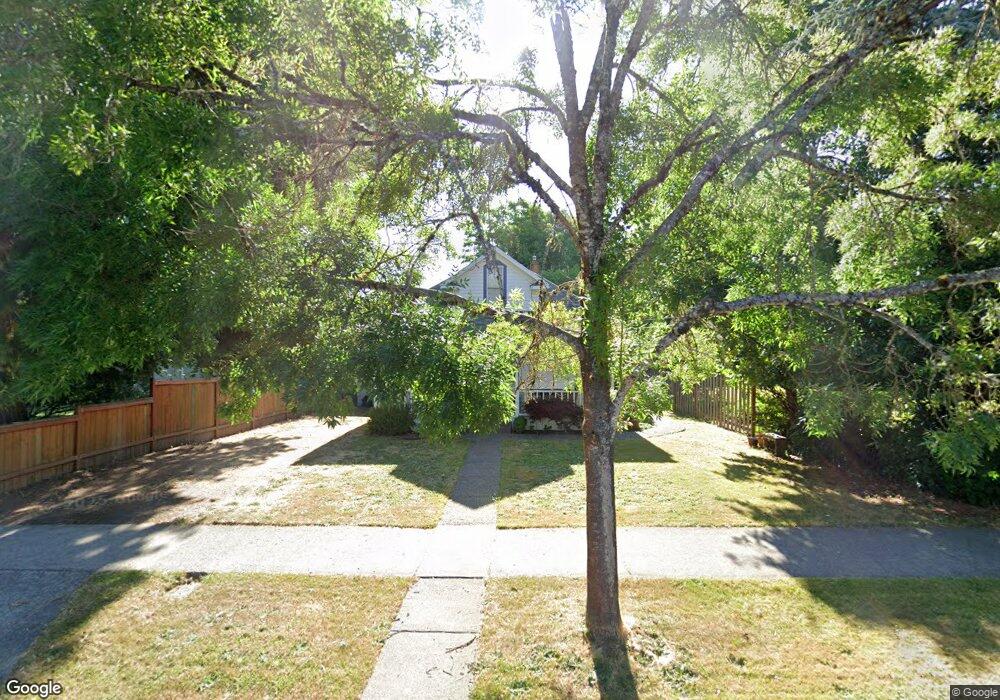
2127 B St Forest Grove, OR 97116
Estimated Value: $328,000 - $481,000
4
Beds
1
Bath
1,344
Sq Ft
$290/Sq Ft
Est. Value
About This Home
This home is located at 2127 B St, Forest Grove, OR 97116 and is currently estimated at $389,433, approximately $289 per square foot. 2127 B St is a home located in Washington County with nearby schools including Harvey Clarke Elementary School, Tom McCall Upper Elementary School, and Neil Armstrong Middle School.
Ownership History
Date
Name
Owned For
Owner Type
Purchase Details
Closed on
Aug 20, 2012
Sold by
Hall Anne F
Bought by
Hall Anne F and Bruckner Leslie Hall
Current Estimated Value
Purchase Details
Closed on
Apr 28, 2005
Sold by
Parsons Floyd and Parsons Sarah E
Bought by
Olson Paul M
Home Financials for this Owner
Home Financials are based on the most recent Mortgage that was taken out on this home.
Original Mortgage
$111,600
Outstanding Balance
$57,736
Interest Rate
5.92%
Mortgage Type
Fannie Mae Freddie Mac
Estimated Equity
$331,697
Purchase Details
Closed on
Apr 26, 2005
Sold by
Olson Paul M
Bought by
Olson Paul M and Frawley Jerry D
Home Financials for this Owner
Home Financials are based on the most recent Mortgage that was taken out on this home.
Original Mortgage
$111,600
Outstanding Balance
$57,736
Interest Rate
5.92%
Mortgage Type
Fannie Mae Freddie Mac
Estimated Equity
$331,697
Create a Home Valuation Report for This Property
The Home Valuation Report is an in-depth analysis detailing your home's value as well as a comparison with similar homes in the area
Purchase History
| Date | Buyer | Sale Price | Title Company |
|---|---|---|---|
| Hall Anne F | -- | None Available | |
| Olson Paul M | $139,500 | Pacific Nw Title | |
| Olson Paul M | -- | -- |
Source: Public Records
Mortgage History
| Date | Status | Borrower | Loan Amount |
|---|---|---|---|
| Open | Olson Paul M | $111,600 |
Source: Public Records
Tax History
| Year | Tax Paid | Tax Assessment Tax Assessment Total Assessment is a certain percentage of the fair market value that is determined by local assessors to be the total taxable value of land and additions on the property. | Land | Improvement |
|---|---|---|---|---|
| 2026 | $2,969 | $166,700 | -- | -- |
| 2025 | $2,969 | $161,850 | -- | -- |
| 2024 | $2,864 | $157,140 | -- | -- |
| 2023 | $2,864 | $152,570 | $0 | $0 |
| 2022 | $2,504 | $152,570 | $0 | $0 |
| 2021 | $2,472 | $143,820 | $0 | $0 |
| 2020 | $2,459 | $139,640 | $0 | $0 |
| 2019 | $2,404 | $135,580 | $0 | $0 |
| 2018 | $2,330 | $131,640 | $0 | $0 |
| 2017 | $2,258 | $127,810 | $0 | $0 |
| 2016 | $2,195 | $124,090 | $0 | $0 |
| 2015 | $2,110 | $120,480 | $0 | $0 |
| 2014 | $2,096 | $116,980 | $0 | $0 |
Source: Public Records
Map
Nearby Homes
Your Personal Tour Guide
Ask me questions while you tour the home.