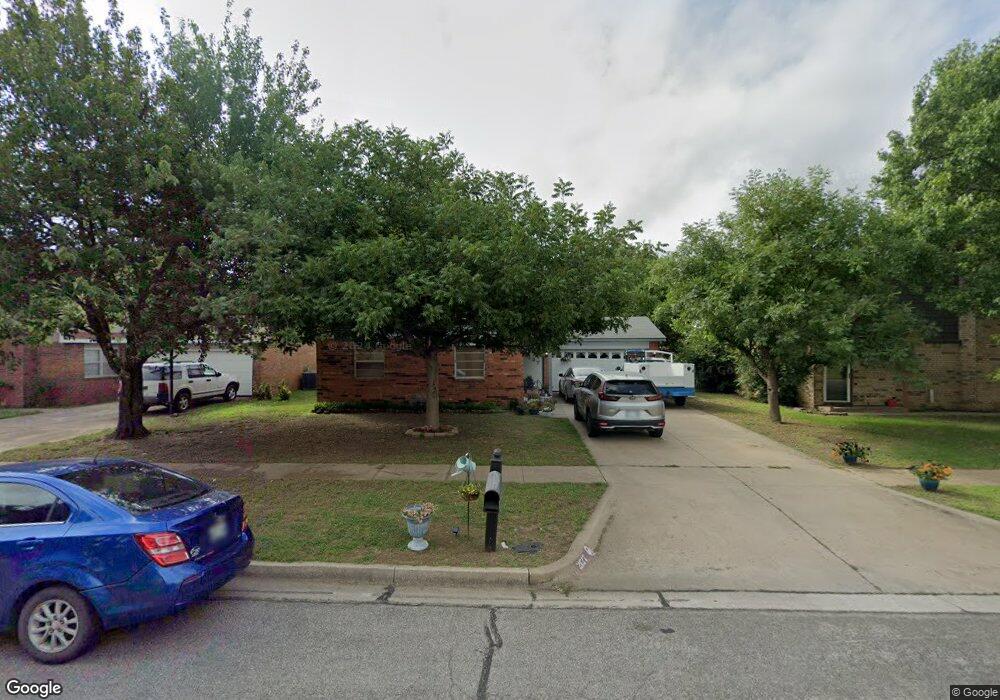
2127 Canary Dr Ponca City, OK 74601
Estimated Value: $190,000 - $214,000
4
Beds
3
Baths
2,164
Sq Ft
$94/Sq Ft
Est. Value
About This Home
This home is located at 2127 Canary Dr, Ponca City, OK 74601 and is currently estimated at $202,799, approximately $93 per square foot. 2127 Canary Dr is a home located in Kay County with nearby schools including Union Elementary School, Ponca City East Middle School, and Ponca City West Middle School.
Ownership History
Date
Name
Owned For
Owner Type
Purchase Details
Closed on
Jul 17, 2023
Sold by
Federal Housing Commissioner
Bought by
Ramirez Alfonso Montes D
Current Estimated Value
Home Financials for this Owner
Home Financials are based on the most recent Mortgage that was taken out on this home.
Original Mortgage
$77,600
Outstanding Balance
$75,707
Interest Rate
6.67%
Mortgage Type
New Conventional
Estimated Equity
$127,092
Purchase Details
Closed on
Apr 17, 2017
Sold by
Willsie Leon W and Willsie Judy Catherine
Bought by
Williams Charlene J
Home Financials for this Owner
Home Financials are based on the most recent Mortgage that was taken out on this home.
Original Mortgage
$133,438
Interest Rate
4.25%
Mortgage Type
FHA
Purchase Details
Closed on
Sep 4, 2012
Sold by
Michael E
Bought by
Willsie Leon W and Willsie Judy C
Create a Home Valuation Report for This Property
The Home Valuation Report is an in-depth analysis detailing your home's value as well as a comparison with similar homes in the area
Home Values in the Area
Average Home Value in this Area
Purchase History
| Date | Buyer | Sale Price | Title Company |
|---|---|---|---|
| Ramirez Alfonso Montes D | -- | None Listed On Document | |
| Williams Charlene J | $135,900 | Security Title Service | |
| Willsie Leon W | $95,000 | -- |
Source: Public Records
Mortgage History
| Date | Status | Borrower | Loan Amount |
|---|---|---|---|
| Open | Ramirez Alfonso Montes D | $77,600 | |
| Previous Owner | Williams Charlene J | $133,438 |
Source: Public Records
Tax History Compared to Growth
Tax History
| Year | Tax Paid | Tax Assessment Tax Assessment Total Assessment is a certain percentage of the fair market value that is determined by local assessors to be the total taxable value of land and additions on the property. | Land | Improvement |
|---|---|---|---|---|
| 2024 | $1,868 | $19,732 | $1,951 | $17,781 |
| 2023 | $1,868 | $15,029 | $1,951 | $13,078 |
| 2022 | $1,293 | $14,591 | $1,951 | $12,640 |
| 2021 | $1,300 | $14,591 | $1,951 | $12,640 |
| 2020 | $1,287 | $14,591 | $1,951 | $12,640 |
| 2019 | $1,262 | $14,210 | $1,951 | $12,259 |
| 2018 | $1,351 | $14,949 | $1,951 | $12,998 |
| 2017 | $963 | $9,821 | $748 | $9,073 |
| 2016 | $1,026 | $10,365 | $748 | $9,617 |
| 2015 | $1,028 | $10,337 | $748 | $9,589 |
| 2014 | $1,009 | $10,340 | $748 | $9,592 |
Source: Public Records
Map
Nearby Homes
- 0000 N Union St
- 113 E Fresno Ave
- 2005 N 4th St
- 1708 Potomac Dr
- 2000 N 5th St
- 304 E Detroit Ave
- 1217 N Pine St
- 120 E Woodbury Rd
- TBD 5th and Windsor
- 1016 N Oak St
- 1412 Donahoe Dr
- 1008 N 1st St
- 1021 Riviera Dr
- 941 N Ash St
- 1013 N 7th St
- 920 N 4th St
- 734 E Albany Ave
- 3651 N 14th St
- 505 N Pine St
- 740 N Pine St
- 2125 Canary Dr
- 2131 Canary Dr
- 2121 Canary Dr
- 2116 N Osage St
- 2201 Canary Dr
- 2120 N Osage St
- 2112 N Osage St
- 101 Canary Place
- 2124 N Osage St
- 2108 N Osage St
- 2119 Canary Dr
- 2205 Canary Dr
- 2132 Canary Dr
- 2128 N Osage St
- 2104 N Osage St
- 105 Canary Place
- 2200 Canary Dr
- 2117 Canary Dr
- 100 Canary Place
- 2209 Canary Dr