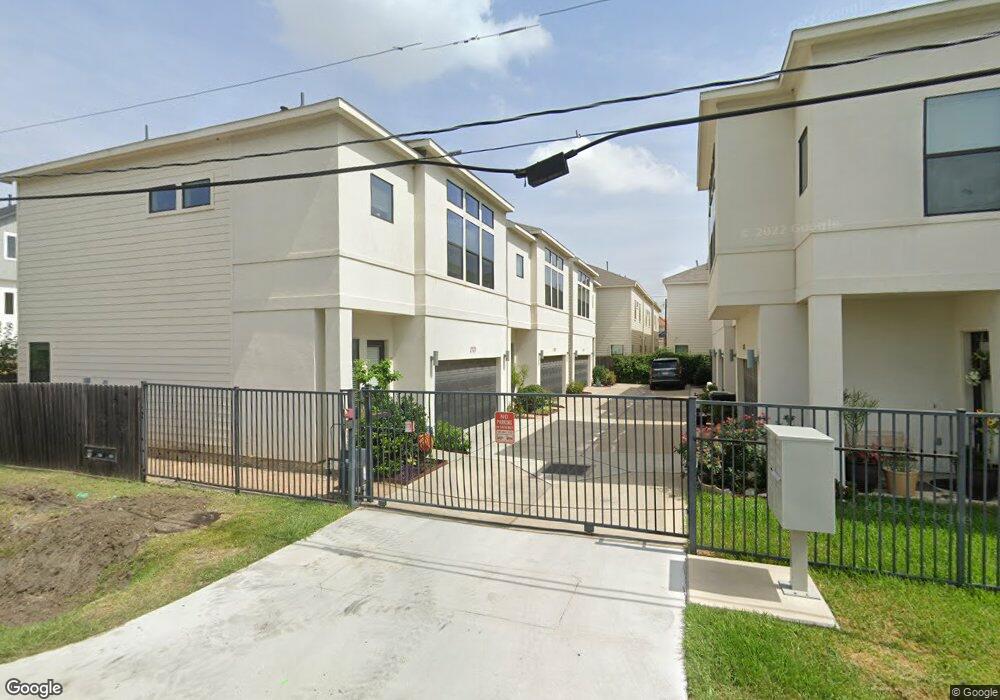
2127 Engelmohr St Houston, TX 77054
Astrodome NeighborhoodEstimated Value: $333,280 - $378,000
3
Beds
3
Baths
1,568
Sq Ft
$230/Sq Ft
Est. Value
About This Home
This home is located at 2127 Engelmohr St, Houston, TX 77054 and is currently estimated at $360,570, approximately $229 per square foot. 2127 Engelmohr St is a home located in Harris County with nearby schools including Whidby Elementary School, Cullen Middle School, and Lamar High School.
Ownership History
Date
Name
Owned For
Owner Type
Purchase Details
Closed on
Dec 18, 2024
Sold by
Series Of Vidat Llc
Bought by
Dao Truong Living Trust and Dao
Current Estimated Value
Purchase Details
Closed on
Feb 21, 2018
Sold by
Dao Dat and Truong Vi
Bought by
Vidat Llc
Purchase Details
Closed on
Jun 13, 2017
Sold by
1226 W Bell Llc
Bought by
Truong Vi and Dao Dat
Home Financials for this Owner
Home Financials are based on the most recent Mortgage that was taken out on this home.
Original Mortgage
$238,258
Interest Rate
4.02%
Mortgage Type
New Conventional
Purchase Details
Closed on
Sep 17, 2015
Sold by
Yinren Real Estate Usa Inc
Bought by
1226 W Bell Street Llc
Purchase Details
Closed on
Oct 16, 2006
Sold by
Shanti Ihsan and Shanti Abdallah
Bought by
Chinese American Yinren Real Estate Co
Create a Home Valuation Report for This Property
The Home Valuation Report is an in-depth analysis detailing your home's value as well as a comparison with similar homes in the area
Home Values in the Area
Average Home Value in this Area
Purchase History
| Date | Buyer | Sale Price | Title Company |
|---|---|---|---|
| Dao Truong Living Trust | -- | None Listed On Document | |
| Vidat Llc | -- | None Available | |
| Truong Vi | -- | Texas American Title Co | |
| 1226 W Bell Street Llc | -- | Charter Title Co | |
| Chinese American Yinren Real Estate Co | -- | Stewart Title Houston Divisi |
Source: Public Records
Mortgage History
| Date | Status | Borrower | Loan Amount |
|---|---|---|---|
| Previous Owner | Truong Vi | $238,258 |
Source: Public Records
Tax History Compared to Growth
Tax History
| Year | Tax Paid | Tax Assessment Tax Assessment Total Assessment is a certain percentage of the fair market value that is determined by local assessors to be the total taxable value of land and additions on the property. | Land | Improvement |
|---|---|---|---|---|
| 2025 | $7,074 | $357,996 | $89,327 | $268,669 |
| 2024 | $7,074 | $338,068 | $89,327 | $248,741 |
| 2023 | $7,074 | $332,277 | $89,327 | $242,950 |
| 2022 | $6,785 | $308,140 | $89,327 | $218,813 |
| 2021 | $6,931 | $297,391 | $89,327 | $208,064 |
| 2020 | $7,280 | $300,643 | $89,327 | $211,316 |
| 2019 | $7,109 | $280,936 | $79,402 | $201,534 |
| 2018 | $7,212 | $285,016 | $79,402 | $205,614 |
| 2017 | $5,084 | $201,047 | $79,402 | $121,645 |
| 2016 | $1,340 | $53,000 | $53,000 | $0 |
| 2015 | $1,362 | $53,000 | $53,000 | $0 |
| 2014 | $1,362 | $53,000 | $53,000 | $0 |
Source: Public Records
Map
Nearby Homes
- 2105 Engelmohr St Unit F
- 2105 Engelmohr St Unit G
- 2214 Naomi St
- 2212 Naomi St
- 2234 Naomi St
- 8299 Cambridge St Unit 703
- 8299 Cambridge St Unit 602
- 8299 Cambridge St Unit 1801
- 8299 Cambridge St Unit 706
- 8225 Cambridge St
- 8227 Cambridge St
- 2425 Holly Hall St Unit A3
- 2425 Holly Hall St Unit 139
- 8100 Cambridge St Unit 32
- 8100 Cambridge St Unit 19
- 8100 Cambridge St Unit 40
- 8100 Cambridge St Unit 119
- 8100 Cambridge St Unit 112
- 2120 El Paseo St Unit 1408
- 2120 El Paseo St Unit 2905
- 2125 Engelmohr St
- 2124 Naomi St
- 2129 Engelmohr St
- 2134 Naomi St
- 2131 Engelmohr St
- 2122 Naomi St
- 2123 Engelmohr St
- 2126 Naomi St
- 2133 Engelmohr St
- 2132 Naomi St
- 2120 Naomi St
- 2128 Naomi St
- 2136 Naomi St
- 2130 Naomi St
- 2118 Naomi St
- 2116 Naomi St Unit D
- 2116 Naomi St Unit C
- 2116 Naomi St Unit B
- 2116 Naomi St Unit A
- 2116 Naomi St Unit A