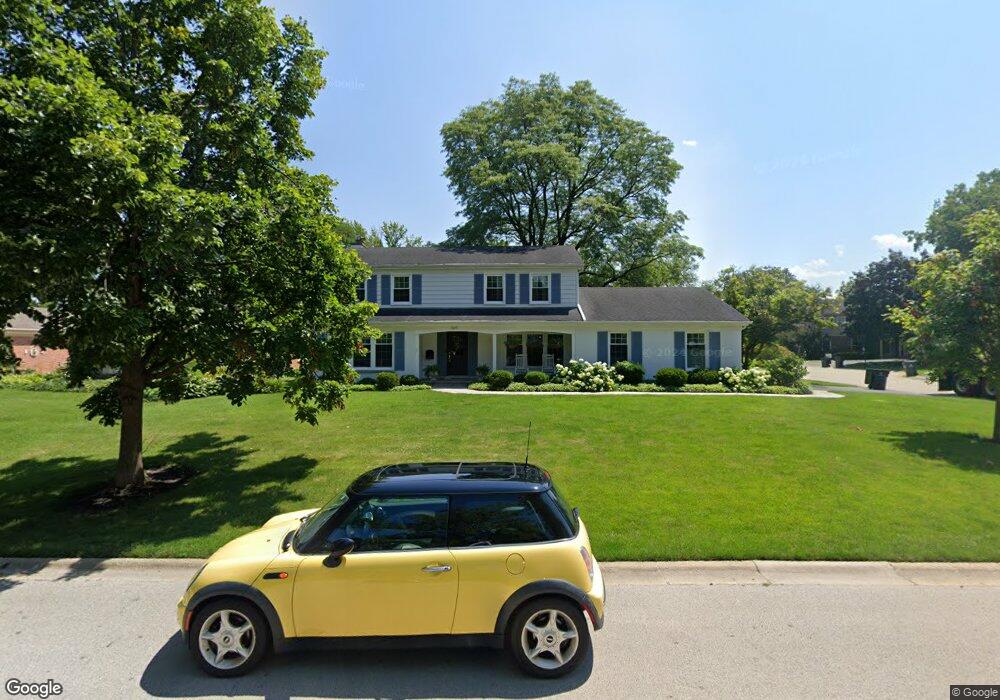
2127 Larkdale Dr Glenview, IL 60025
Estimated Value: $1,054,000 - $1,294,000
5
Beds
3
Baths
2,732
Sq Ft
$426/Sq Ft
Est. Value
About This Home
This home is located at 2127 Larkdale Dr, Glenview, IL 60025 and is currently estimated at $1,164,112, approximately $426 per square foot. 2127 Larkdale Dr is a home located in Cook County with nearby schools including Hoffman Elementary School, Henking Elementary School, and Springman Middle School.
Ownership History
Date
Name
Owned For
Owner Type
Purchase Details
Closed on
Nov 12, 2020
Sold by
Phelan William H and Phelan Margaret A
Bought by
Phelan 2021 Gift Trust and Phelan
Current Estimated Value
Purchase Details
Closed on
Apr 29, 2004
Sold by
Hoyland Thomas J and Hoyland Nancy M
Bought by
Phelan William H and Phelan Margaret A
Home Financials for this Owner
Home Financials are based on the most recent Mortgage that was taken out on this home.
Original Mortgage
$333,000
Interest Rate
5.91%
Mortgage Type
Unknown
Purchase Details
Closed on
Sep 19, 1996
Sold by
Lasalle National Trust Na
Bought by
Hoyland Thomas J and Hoyland Nancy M
Create a Home Valuation Report for This Property
The Home Valuation Report is an in-depth analysis detailing your home's value as well as a comparison with similar homes in the area
Home Values in the Area
Average Home Value in this Area
Purchase History
| Date | Buyer | Sale Price | Title Company |
|---|---|---|---|
| Phelan 2021 Gift Trust | -- | None Listed On Document | |
| Phelan 2021 Gift Trust | -- | None Listed On Document | |
| Phelan William H | $685,000 | Ticor | |
| Hoyland Thomas J | $465,000 | -- |
Source: Public Records
Mortgage History
| Date | Status | Borrower | Loan Amount |
|---|---|---|---|
| Previous Owner | Phelan William H | $333,000 |
Source: Public Records
Tax History Compared to Growth
Tax History
| Year | Tax Paid | Tax Assessment Tax Assessment Total Assessment is a certain percentage of the fair market value that is determined by local assessors to be the total taxable value of land and additions on the property. | Land | Improvement |
|---|---|---|---|---|
| 2024 | $16,495 | $74,525 | $16,784 | $57,741 |
| 2023 | $16,030 | $74,525 | $16,784 | $57,741 |
| 2022 | $16,030 | $74,525 | $16,784 | $57,741 |
| 2021 | $16,125 | $64,785 | $12,850 | $51,935 |
| 2020 | $15,171 | $64,785 | $12,850 | $51,935 |
| 2019 | $14,134 | $71,193 | $12,850 | $58,343 |
| 2018 | $13,385 | $61,632 | $11,276 | $50,356 |
| 2017 | $13,041 | $61,632 | $11,276 | $50,356 |
| 2016 | $12,931 | $63,629 | $11,276 | $52,353 |
| 2015 | $11,222 | $49,748 | $9,178 | $40,570 |
| 2014 | $11,029 | $49,748 | $9,178 | $40,570 |
| 2013 | $10,679 | $49,748 | $9,178 | $40,570 |
Source: Public Records
Map
Nearby Homes
- 517 Briarhill Ln
- 2137 Glenview Rd
- 1821 George Ct
- 1800 Dewes St Unit 305
- 1800 Dewes St Unit 201
- 1800 Dewes St Unit 309
- 315 Lincoln St
- 2121 Fir St
- 1088 Shermer Rd Unit DW
- 245 Nora Ave
- 1220 Depot St Unit 305
- 1220 Depot St Unit 109
- 1220 Depot St Unit 409
- 609 Carriage Hill Dr
- 601 Carriage Hill Dr
- 711 Carriage Hill Dr
- 713 Carriage Hill Dr
- 2700 Fontana Dr
- 137 Julie Dr
- 1341 Greenwillow Ln Unit C
- 2121 Larkdale Dr
- 2131 Larkdale Dr
- 2131 Larkdale Dr
- 2141 Larkdale Dr
- 2113 Larkdale Dr
- 2135 Larkdale Dr
- 2111 Larkdale Dr
- 2132 Larkdale Dr
- 2126 Larkdale Dr
- 2139 Larkdale Dr
- 2136 Larkdale Dr
- 2120 Larkdale Dr
- 725 Spruce St
- 2136 Robincrest Ln
- 2116 Larkdale Dr
- 711 Spruce St
- 2144 Larkdale Dr
- 2109 Larkdale Dr
- 2105 Larkdale Dr
- 2138 Robincrest Ln