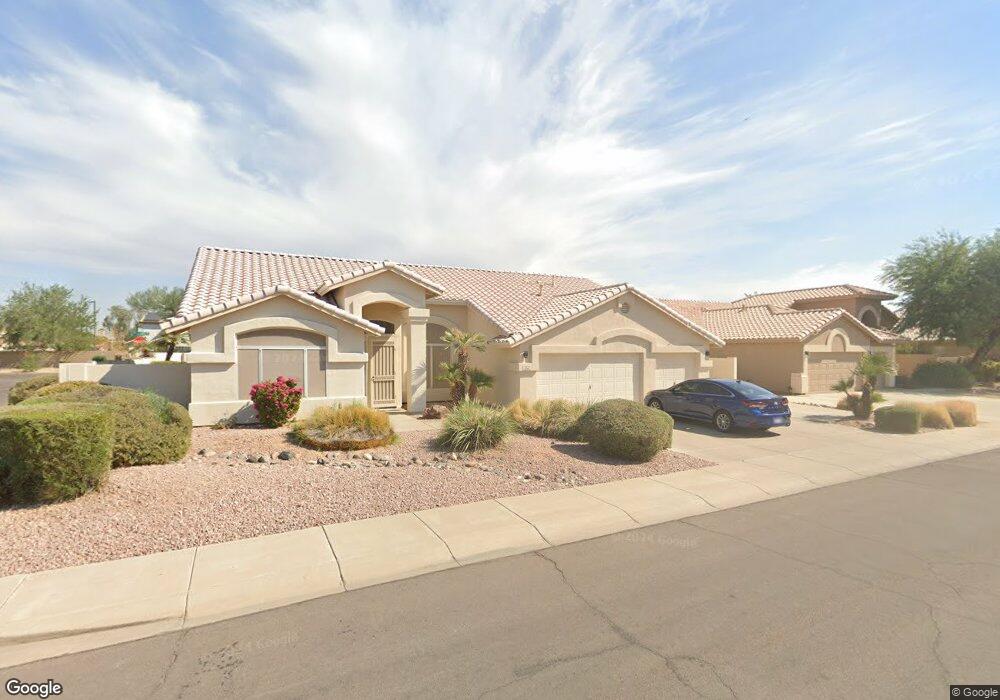
2127 N 132nd Dr Unit I Goodyear, AZ 85395
Palm Valley NeighborhoodEstimated Value: $615,657 - $799,000
4
Beds
3
Baths
3,742
Sq Ft
$184/Sq Ft
Est. Value
About This Home
This home is located at 2127 N 132nd Dr Unit I, Goodyear, AZ 85395 and is currently estimated at $687,164, approximately $183 per square foot. 2127 N 132nd Dr Unit I is a home located in Maricopa County with nearby schools including Palm Valley Elementary School, Wigwam Creek Middle School, and Valor Preparatory Academy.
Ownership History
Date
Name
Owned For
Owner Type
Purchase Details
Closed on
Sep 28, 2004
Sold by
Lee Aljareda Jones
Bought by
Bosson Thomas J and Bosson Barbara
Current Estimated Value
Home Financials for this Owner
Home Financials are based on the most recent Mortgage that was taken out on this home.
Original Mortgage
$333,700
Interest Rate
5.76%
Mortgage Type
New Conventional
Purchase Details
Closed on
Jun 26, 2002
Sold by
Noehring Mark D and Noehring Kari A
Bought by
Lee Saul and Lee Aljareda Jones
Purchase Details
Closed on
Sep 3, 1998
Sold by
Suncor Development Company
Bought by
Noehring Mark D and Noehring Kari A
Home Financials for this Owner
Home Financials are based on the most recent Mortgage that was taken out on this home.
Original Mortgage
$215,000
Interest Rate
6.92%
Mortgage Type
New Conventional
Create a Home Valuation Report for This Property
The Home Valuation Report is an in-depth analysis detailing your home's value as well as a comparison with similar homes in the area
Home Values in the Area
Average Home Value in this Area
Purchase History
| Date | Buyer | Sale Price | Title Company |
|---|---|---|---|
| Bosson Thomas J | $372,000 | Stewart Title & Trust Of Pho | |
| Lee Saul | $315,000 | Capital Title Agency Inc | |
| Noehring Mark D | $238,908 | Chicago Title Insurance Co |
Source: Public Records
Mortgage History
| Date | Status | Borrower | Loan Amount |
|---|---|---|---|
| Closed | Bosson Thomas J | $333,700 | |
| Previous Owner | Noehring Mark D | $215,000 |
Source: Public Records
Tax History Compared to Growth
Tax History
| Year | Tax Paid | Tax Assessment Tax Assessment Total Assessment is a certain percentage of the fair market value that is determined by local assessors to be the total taxable value of land and additions on the property. | Land | Improvement |
|---|---|---|---|---|
| 2025 | $3,704 | $35,370 | -- | -- |
| 2024 | $3,565 | $33,686 | -- | -- |
| 2023 | $3,565 | $49,580 | $9,910 | $39,670 |
| 2022 | $3,436 | $38,000 | $7,600 | $30,400 |
| 2021 | $3,585 | $35,530 | $7,100 | $28,430 |
| 2020 | $3,511 | $33,110 | $6,620 | $26,490 |
| 2019 | $3,390 | $30,860 | $6,170 | $24,690 |
| 2018 | $3,349 | $30,750 | $6,150 | $24,600 |
| 2017 | $3,177 | $28,520 | $5,700 | $22,820 |
| 2016 | $3,053 | $26,520 | $5,300 | $21,220 |
| 2015 | $2,834 | $29,080 | $5,810 | $23,270 |
Source: Public Records
Map
Nearby Homes
- 12938 W Alvarado Rd
- 12913 W Wilshire Dr
- 1858 N 128th Dr
- 13145 W Cambridge Ave
- 13458 W Coronado Rd
- 13524 W Alvarado Dr
- 1825 N 128th Ave
- 13160 W Windsor Ave
- 13511 Fairway Loop S Unit 35G2
- 13587 W Cypress St
- 13613 W Cypress St
- 13641 W Alvarado Dr
- 13350 W La Reata Ave
- 12709 W Virginia Ave
- 2004 N 125th Ave
- 13722 W Vernon Ave Unit 1
- 2024 N 125th Ave
- 13743 W Windsor Ave
- 3010 N 129th Dr
- 2022 N 124th Dr
- 10522 W Alvarado Dr
- 2113 N 132nd Dr
- 2155 N 132nd Dr
- 13263 W Alvarado Dr Unit II
- 13215 W Alvarado Cir
- 2099 N 132nd Dr
- 13216 W Monte Vista Dr
- 13207 W Alvarado Cir
- 2092 N 132nd Dr
- 2169 N 132nd Dr Unit II
- 2148 N 132nd Dr
- 13208 W Monte Vista Dr
- 13275 W Alvarado Dr
- 2085 N 132nd Dr
- 13199 W Alvarado Cir
- 13200 W Monte Vista Dr
- 2078 N 132nd Dr
- 13210 W Alvarado Cir
- 2162 N 132nd Dr
- 13192 W Monte Vista Dr