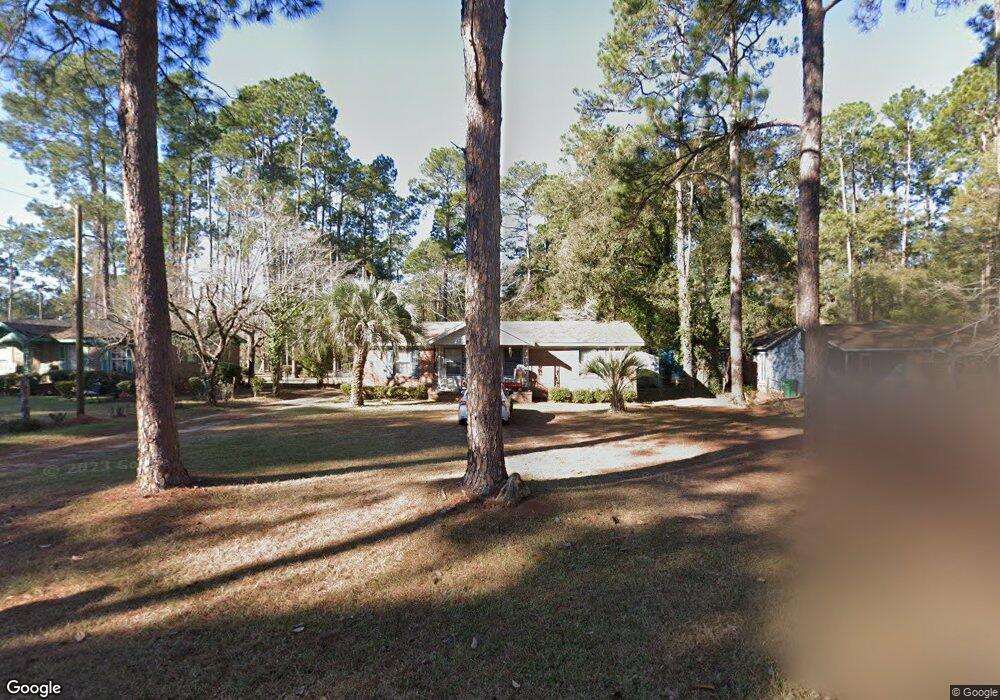
2127 Oxford Rd Albany, GA 31721
Estimated Value: $86,000 - $119,000
3
Beds
2
Baths
1,248
Sq Ft
$83/Sq Ft
Est. Value
About This Home
This home is located at 2127 Oxford Rd, Albany, GA 31721 and is currently estimated at $103,300, approximately $82 per square foot. 2127 Oxford Rd is a home located in Dougherty County with nearby schools including Alice Coachman Elementary School, Southside Middle School, and Monroe High School.
Ownership History
Date
Name
Owned For
Owner Type
Purchase Details
Closed on
Sep 15, 2025
Sold by
Holman Home Improvement Llc
Bought by
Holman Larry and Holman Sherry
Current Estimated Value
Purchase Details
Closed on
Oct 14, 2016
Bought by
Holman Home Improvement Llc
Purchase Details
Closed on
Oct 6, 2015
Sold by
Carrington Mtg Svcs Llc
Bought by
Sec Of Housing & Urban D
Purchase Details
Closed on
Apr 15, 2008
Sold by
Reed Eric S
Bought by
Bell Dawn M
Home Financials for this Owner
Home Financials are based on the most recent Mortgage that was taken out on this home.
Original Mortgage
$74,825
Interest Rate
5.84%
Mortgage Type
FHA
Purchase Details
Closed on
Jun 1, 2007
Sold by
Jones Melvin L
Bought by
Bell Dawn M
Purchase Details
Closed on
Jun 7, 1974
Sold by
Carter Horace Etal
Bought by
Jones Melvin Etal
Create a Home Valuation Report for This Property
The Home Valuation Report is an in-depth analysis detailing your home's value as well as a comparison with similar homes in the area
Home Values in the Area
Average Home Value in this Area
Purchase History
| Date | Buyer | Sale Price | Title Company |
|---|---|---|---|
| Holman Larry | -- | -- | |
| Holman Home Improvement Llc | -- | -- | |
| Sec Of Housing & Urban D | $43,120 | -- | |
| Bell Dawn M | $76,000 | -- | |
| Bell Dawn M | $35,000 | -- | |
| Jones Melvin Etal | -- | -- |
Source: Public Records
Mortgage History
| Date | Status | Borrower | Loan Amount |
|---|---|---|---|
| Previous Owner | Bell Dawn M | $74,825 | |
| Closed | Bell Dawn M | $0 |
Source: Public Records
Tax History Compared to Growth
Tax History
| Year | Tax Paid | Tax Assessment Tax Assessment Total Assessment is a certain percentage of the fair market value that is determined by local assessors to be the total taxable value of land and additions on the property. | Land | Improvement |
|---|---|---|---|---|
| 2024 | $1,439 | $30,160 | $2,920 | $27,240 |
| 2023 | $1,405 | $30,160 | $2,920 | $27,240 |
| 2022 | $1,410 | $30,160 | $2,920 | $27,240 |
| 2021 | $1,308 | $30,160 | $2,920 | $27,240 |
| 2020 | $1,311 | $30,160 | $2,920 | $27,240 |
| 2019 | $1,316 | $30,160 | $2,920 | $27,240 |
| 2018 | $1,321 | $30,160 | $2,920 | $27,240 |
| 2017 | $1,231 | $30,160 | $2,920 | $27,240 |
| 2016 | $1,231 | $30,160 | $2,920 | $27,240 |
| 2015 | $1,235 | $30,160 | $2,920 | $27,240 |
| 2014 | $1,202 | $29,720 | $2,480 | $27,240 |
Source: Public Records
Map
Nearby Homes
- 2101 Goldendale Ln
- 2307 Evergreen Dr
- 6102 Newton Rd
- 2102 Techwood Dr
- 2303 Joel Dr
- 1918 Colquitt Ave
- 1104 University St
- 1029 Davidson Dr
- 1513 Colquitt Ave
- 2013 Jones Ave
- 802 Colquitt Cir
- 1003 University St
- 1409 Colquitt Ave
- 1610 W Gordon Ave
- 5404 Paulk Dr
- 1705 W Gordon Ave
- 1804 W Lincoln Ave
- 1714 W Lincoln Ave
- 5407 Paulk Dr
- 1207 S Cleveland St
- 2129 Oxford Rd
- 2125 Oxford Rd
- 2123 Oxford Rd
- 2208 Kirkwood Rd
- 2121 Oxford Rd
- 2210 Kirkwood Rd
- 2206 Kirkwood Rd
- 2204 Kirkwood Rd
- 2103 Goldendale Ln
- 2126 Oxford Rd
- 2122 Oxford Rd
- 2128 Oxford Rd
- 2119 Oxford Rd
- 2202 Kirkwood Rd
- 2120 Oxford Rd
- 2102 Goldendale Ln
- 2100 Goldendale Ln
- 2200 Kirkwood Rd
- 2117 Oxford Rd
- 2214 Kirkwood Rd