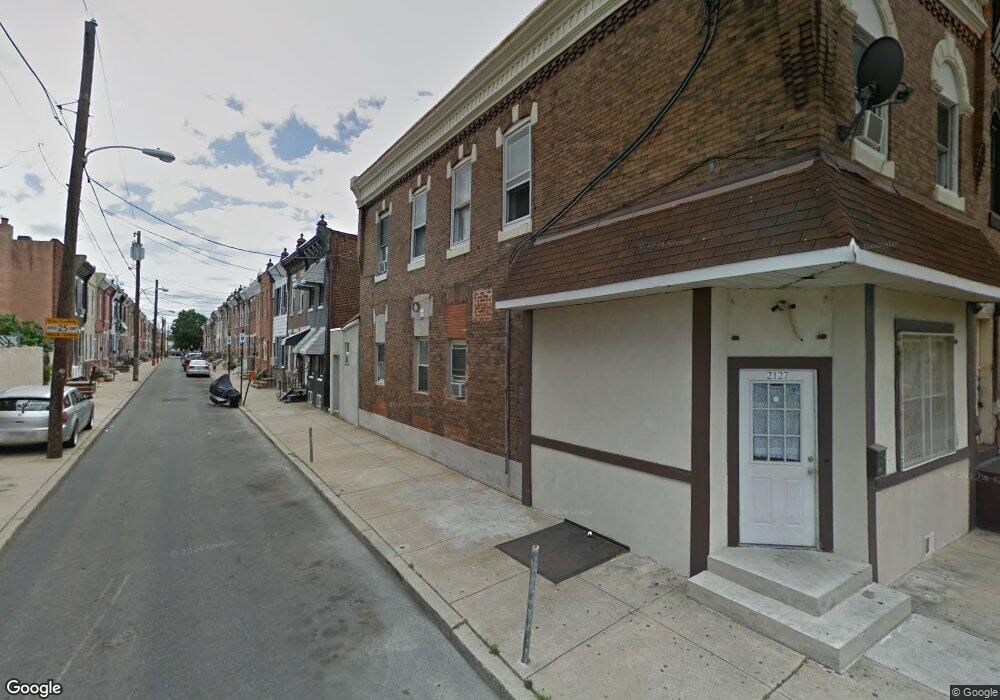
2127 S 4th St Philadelphia, PA 19148
Whitman NeighborhoodEstimated Value: $333,904 - $353,000
--
Bed
3
Baths
1,634
Sq Ft
$212/Sq Ft
Est. Value
About This Home
This home is located at 2127 S 4th St, Philadelphia, PA 19148 and is currently estimated at $346,226, approximately $211 per square foot. 2127 S 4th St is a home located in Philadelphia County with nearby schools including George W. Sharswood School, Furness Horace High School, and Our Lady of Hope.
Ownership History
Date
Name
Owned For
Owner Type
Purchase Details
Closed on
May 30, 2006
Sold by
Murphy Kathleen and Poplar Financial Services Inc
Bought by
Rfr Properties Llc
Current Estimated Value
Purchase Details
Closed on
Apr 30, 2002
Sold by
Milicia Carmine
Bought by
Murphy Kathleen
Home Financials for this Owner
Home Financials are based on the most recent Mortgage that was taken out on this home.
Original Mortgage
$63,800
Interest Rate
6.9%
Mortgage Type
Balloon
Create a Home Valuation Report for This Property
The Home Valuation Report is an in-depth analysis detailing your home's value as well as a comparison with similar homes in the area
Home Values in the Area
Average Home Value in this Area
Purchase History
| Date | Buyer | Sale Price | Title Company |
|---|---|---|---|
| Rfr Properties Llc | $82,100 | None Available | |
| Murphy Kathleen | $100,000 | Fidelity National Title Ins |
Source: Public Records
Mortgage History
| Date | Status | Borrower | Loan Amount |
|---|---|---|---|
| Previous Owner | Murphy Kathleen | $63,800 |
Source: Public Records
Tax History Compared to Growth
Tax History
| Year | Tax Paid | Tax Assessment Tax Assessment Total Assessment is a certain percentage of the fair market value that is determined by local assessors to be the total taxable value of land and additions on the property. | Land | Improvement |
|---|---|---|---|---|
| 2026 | $3,487 | $296,000 | $59,200 | $236,800 |
| 2025 | $3,487 | $296,000 | $59,200 | $236,800 |
| 2024 | $3,487 | $296,000 | $59,200 | $236,800 |
| 2023 | $3,487 | $249,100 | $49,820 | $199,280 |
| 2022 | $3,487 | $249,100 | $49,820 | $199,280 |
| 2021 | $2,801 | $0 | $0 | $0 |
| 2020 | $2,801 | $0 | $0 | $0 |
| 2019 | $2,585 | $0 | $0 | $0 |
| 2018 | $3,253 | $0 | $0 | $0 |
| 2017 | $3,253 | $0 | $0 | $0 |
| 2016 | $3,253 | $0 | $0 | $0 |
| 2015 | $3,114 | $0 | $0 | $0 |
| 2014 | -- | $232,400 | $17,860 | $214,540 |
| 2012 | -- | $10,848 | $2,320 | $8,528 |
Source: Public Records
Map
Nearby Homes