Estimated Value: $456,456 - $570,000
--
Bed
4
Baths
1,883
Sq Ft
$274/Sq Ft
Est. Value
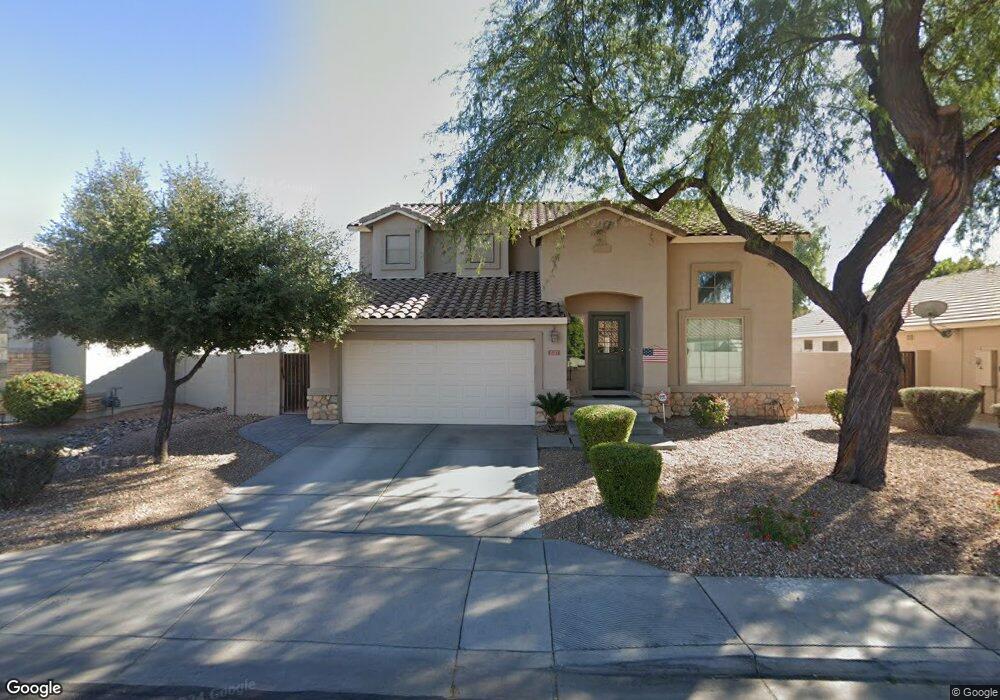
About This Home
This home is located at 2127 S Joplin, Mesa, AZ 85209 and is currently estimated at $516,364, approximately $274 per square foot. 2127 S Joplin is a home located in Maricopa County with nearby schools including Augusta Ranch Elementary School, Desert Ridge Jr. High School, and Desert Ridge High School.
Ownership History
Date
Name
Owned For
Owner Type
Purchase Details
Closed on
Sep 18, 2012
Sold by
James Christopher and James Robin
Bought by
James Robin and James Chris
Current Estimated Value
Home Financials for this Owner
Home Financials are based on the most recent Mortgage that was taken out on this home.
Original Mortgage
$226,090
Outstanding Balance
$157,766
Interest Rate
3.75%
Mortgage Type
FHA
Estimated Equity
$358,598
Purchase Details
Closed on
Jan 21, 2004
Sold by
James Christopher
Bought by
James Christopher and James Robin
Home Financials for this Owner
Home Financials are based on the most recent Mortgage that was taken out on this home.
Original Mortgage
$165,600
Interest Rate
4.75%
Mortgage Type
New Conventional
Purchase Details
Closed on
Oct 5, 2000
Sold by
James Robin
Bought by
James Christopher
Purchase Details
Closed on
Oct 4, 2000
Sold by
Greystone Homes Inc
Bought by
James Christopher
Create a Home Valuation Report for This Property
The Home Valuation Report is an in-depth analysis detailing your home's value as well as a comparison with similar homes in the area
Home Values in the Area
Average Home Value in this Area
Purchase History
| Date | Buyer | Sale Price | Title Company |
|---|---|---|---|
| James Robin | -- | Security Title Agency | |
| James Christopher | -- | First American Title Insuran | |
| James Christopher | -- | North American Title Agency | |
| James Christopher | $190,455 | North American Title |
Source: Public Records
Mortgage History
| Date | Status | Borrower | Loan Amount |
|---|---|---|---|
| Open | James Robin | $226,090 | |
| Closed | James Christopher | $165,600 |
Source: Public Records
Tax History Compared to Growth
Tax History
| Year | Tax Paid | Tax Assessment Tax Assessment Total Assessment is a certain percentage of the fair market value that is determined by local assessors to be the total taxable value of land and additions on the property. | Land | Improvement |
|---|---|---|---|---|
| 2025 | $1,800 | $24,307 | -- | -- |
| 2024 | $1,747 | $23,150 | -- | -- |
| 2023 | $1,747 | $37,650 | $7,530 | $30,120 |
| 2022 | $1,704 | $28,230 | $5,640 | $22,590 |
| 2021 | $1,846 | $26,810 | $5,360 | $21,450 |
| 2020 | $1,814 | $24,510 | $4,900 | $19,610 |
| 2019 | $1,681 | $22,610 | $4,520 | $18,090 |
| 2018 | $1,600 | $21,210 | $4,240 | $16,970 |
| 2017 | $1,550 | $20,110 | $4,020 | $16,090 |
| 2016 | $1,600 | $19,610 | $3,920 | $15,690 |
| 2015 | $1,474 | $19,680 | $3,930 | $15,750 |
Source: Public Records
Map
Nearby Homes
- 9822 E Lompoc Ave
- 9831 E Lompoc Ave
- 9959 E Kiowa Ave
- 2123 S Bristol
- 2024 S Baldwin Unit 156
- 2024 S Baldwin Unit 113
- 2024 S Baldwin Unit 54
- 9631 E Javelina Ave
- 9426 E Los Lagos Vista Ave
- 10154 E Kilarea Ave
- 10162 E Kilarea Ave Unit 2
- 9745 E Jan Ave
- 10226 E Lakeview Ave Unit 1
- 9337 E Kiva Ave
- 9423 E Impala Ave
- 2642 S Joplin
- 9705 E Idaho Ave
- 10310 E Kiva Cir Unit 1
- 1648 S Faith
- 1650 S Crismon Rd Unit 13
- 2121 S Joplin
- 2133 S Joplin
- 2136 S Alicia
- 2130 S Alicia
- 2115 S Joplin
- 9744 E Kiowa Ave
- 2124 S Alicia
- 2116 S Joplin
- 2109 S Joplin
- 9761 E Kiowa Ave
- 9742 E Kiowa Ave
- 9755 E Kiowa Ave
- 9821 E Keats Ave
- 9801 E Kiowa Ave
- 2110 S Joplin
- 9749 E Kiowa Ave
- 9807 E Kiowa Ave
- 9825 E Keats Ave
- 9816 E Lindner Ave
- 9743 E Kiowa Ave