Estimated Value: $389,000 - $403,627
5
Beds
3
Baths
2,250
Sq Ft
$176/Sq Ft
Est. Value
About This Home
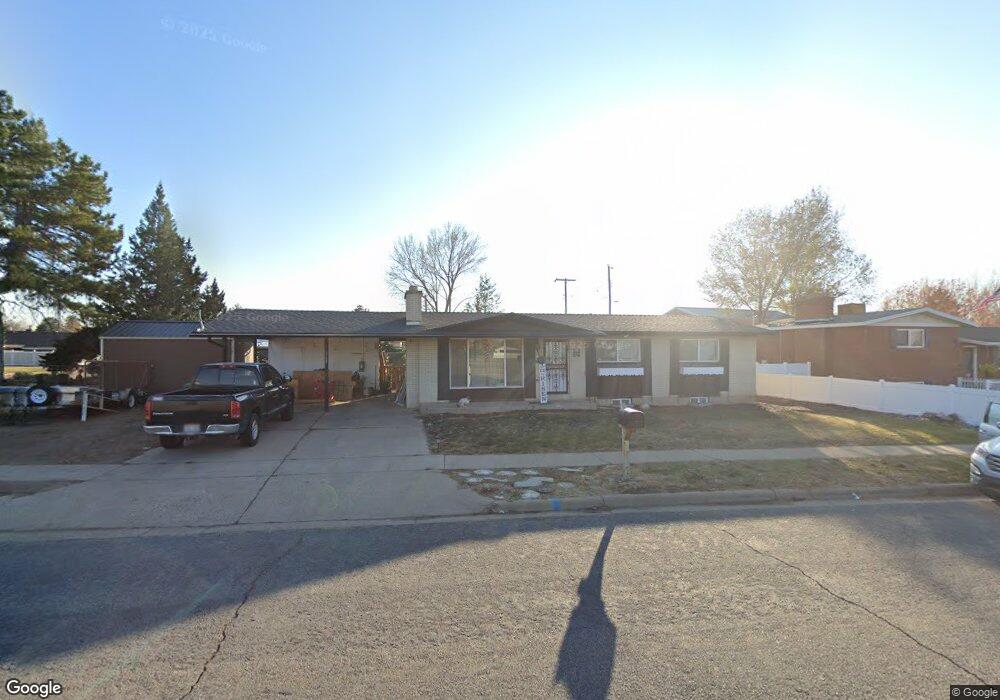
This home is located at 2127 W 4975 S, Roy, UT 84067 and is currently estimated at $396,157, approximately $176 per square foot. 2127 W 4975 S is a home located in Weber County with nearby schools including Lakeview Elementary School, Roy Junior High School, and Roy High School.
Ownership History
Date
Name
Owned For
Owner Type
Purchase Details
Closed on
Jun 20, 2024
Sold by
Harmston Phillip Jay
Bought by
Jays Trust and Harmston
Current Estimated Value
Purchase Details
Closed on
Mar 23, 2020
Sold by
Redline Properties Llc
Bought by
Harmston Phillip Jay
Home Financials for this Owner
Home Financials are based on the most recent Mortgage that was taken out on this home.
Original Mortgage
$244,845
Interest Rate
3.4%
Mortgage Type
FHA
Purchase Details
Closed on
Nov 7, 2019
Sold by
Redline Properties Ii Llc
Bought by
Redline Properties Llc
Purchase Details
Closed on
Nov 1, 2019
Sold by
Poulsen Team Llc
Bought by
Redline Properties Ii Llc
Purchase Details
Closed on
Oct 31, 2019
Sold by
Duke William D
Bought by
Poulsen Team Llc
Purchase Details
Closed on
Mar 4, 2009
Sold by
Duke Ruth J
Bought by
Duke Ruth J and Duke William D
Create a Home Valuation Report for This Property
The Home Valuation Report is an in-depth analysis detailing your home's value as well as a comparison with similar homes in the area
Home Values in the Area
Average Home Value in this Area
Purchase History
| Date | Buyer | Sale Price | Title Company |
|---|---|---|---|
| Jays Trust | -- | None Listed On Document | |
| Harmston Phillip Jay | -- | Stewart Title Ins Agcy Of Ut | |
| Redline Properties Llc | -- | Stewart Title Ins Agcy Of | |
| Redline Properties Ii Llc | -- | Stewart Title Ins Agency Of | |
| Poulsen Team Llc | -- | First American Title Ins Co | |
| Duke Ruth J | -- | None Available |
Source: Public Records
Mortgage History
| Date | Status | Borrower | Loan Amount |
|---|---|---|---|
| Previous Owner | Harmston Phillip Jay | $244,845 |
Source: Public Records
Tax History
| Year | Tax Paid | Tax Assessment Tax Assessment Total Assessment is a certain percentage of the fair market value that is determined by local assessors to be the total taxable value of land and additions on the property. | Land | Improvement |
|---|---|---|---|---|
| 2025 | $2,401 | $375,551 | $126,265 | $249,286 |
| 2024 | $2,302 | $197,449 | $69,446 | $128,003 |
| 2023 | $2,250 | $352,000 | $119,515 | $232,485 |
| 2022 | $2,498 | $407,000 | $108,839 | $298,161 |
| 2021 | $1,876 | $272,000 | $72,748 | $199,252 |
| 2020 | $1,790 | $239,000 | $72,748 | $166,252 |
| 2019 | $1,762 | $222,000 | $42,357 | $179,643 |
| 2018 | $1,582 | $186,000 | $39,157 | $146,843 |
| 2017 | $1,444 | $158,000 | $39,157 | $118,843 |
| 2016 | $1,229 | $84,359 | $19,688 | $64,671 |
| 2015 | $1,051 | $74,364 | $19,688 | $54,676 |
| 2014 | $1,062 | $74,303 | $16,808 | $57,495 |
Source: Public Records
Map
Nearby Homes
Your Personal Tour Guide
Ask me questions while you tour the home.