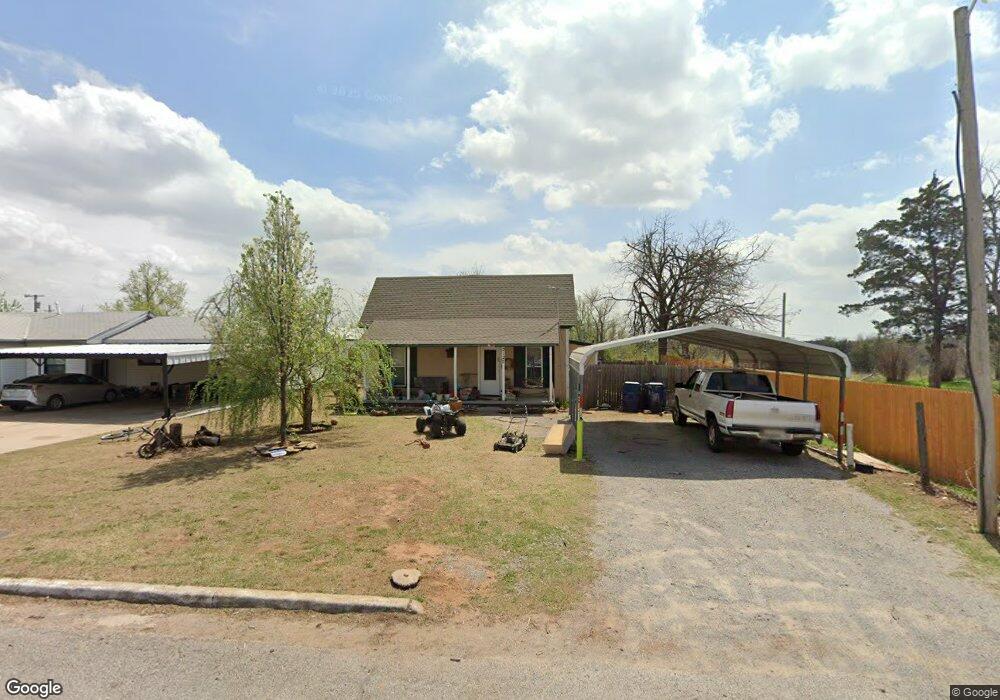
2127 W Dakota Ave Chickasha, OK 73018
Estimated Value: $54,000 - $109,000
2
Beds
1
Bath
927
Sq Ft
$99/Sq Ft
Est. Value
About This Home
This home is located at 2127 W Dakota Ave, Chickasha, OK 73018 and is currently estimated at $91,519, approximately $98 per square foot. 2127 W Dakota Ave is a home located in Grady County with nearby schools including Grand Avenue Elementary School, Chickasha Middle School, and Lincoln Elementary School.
Ownership History
Date
Name
Owned For
Owner Type
Purchase Details
Closed on
Nov 18, 2021
Sold by
Lambert Sherrie and Lambert William Douglas
Bought by
Grayline Properties Llc
Current Estimated Value
Home Financials for this Owner
Home Financials are based on the most recent Mortgage that was taken out on this home.
Original Mortgage
$32,400
Outstanding Balance
$29,627
Interest Rate
2.99%
Mortgage Type
Construction
Estimated Equity
$61,892
Purchase Details
Closed on
Feb 27, 2014
Sold by
Metz Lola B
Bought by
Robert Shuin
Purchase Details
Closed on
Jul 31, 2002
Sold by
Wilkerson Cora Harmon
Bought by
Trammell Lola B
Purchase Details
Closed on
Aug 31, 1998
Sold by
Burnes Charlotte A
Bought by
Harmon Cora
Purchase Details
Closed on
Aug 30, 1994
Sold by
Herman H Corn
Bought by
Field and Field Burns
Create a Home Valuation Report for This Property
The Home Valuation Report is an in-depth analysis detailing your home's value as well as a comparison with similar homes in the area
Home Values in the Area
Average Home Value in this Area
Purchase History
| Date | Buyer | Sale Price | Title Company |
|---|---|---|---|
| Grayline Properties Llc | $28,000 | Washita Valley Abstract & Tt | |
| Grayline Properties Llc | $13,333 | Washita Valley Abstract & Titl | |
| Metz Lola B | $13,333 | None Listed On Document | |
| Robert Shuin | -- | None Available | |
| Trammell Lola B | $17,500 | -- | |
| Harmon Cora | $17,000 | -- | |
| Field | $2,000 | -- |
Source: Public Records
Mortgage History
| Date | Status | Borrower | Loan Amount |
|---|---|---|---|
| Open | Grayline Properties Llc | $32,400 | |
| Closed | Grayline Properties Llc | $32,400 |
Source: Public Records
Tax History Compared to Growth
Tax History
| Year | Tax Paid | Tax Assessment Tax Assessment Total Assessment is a certain percentage of the fair market value that is determined by local assessors to be the total taxable value of land and additions on the property. | Land | Improvement |
|---|---|---|---|---|
| 2025 | $344 | $3,566 | $952 | $2,614 |
| 2024 | $344 | $3,396 | $907 | $2,489 |
| 2023 | $344 | $3,234 | $781 | $2,453 |
| 2022 | $320 | $3,080 | $436 | $2,644 |
| 2021 | $326 | $3,246 | $412 | $2,834 |
| 2020 | $318 | $3,092 | $396 | $2,696 |
| 2019 | $297 | $2,944 | $380 | $2,564 |
| 2018 | $289 | $2,804 | $359 | $2,445 |
| 2017 | $276 | $2,670 | $343 | $2,327 |
| 2016 | $266 | $2,544 | $323 | $2,221 |
| 2015 | $242 | $2,422 | $275 | $2,147 |
| 2014 | $242 | $2,307 | $254 | $2,053 |
Source: Public Records
Map
Nearby Homes
- 2012 W Idaho Ave
- 1928 W Idaho Ave
- 610 S 19th St
- 622 S 16th St
- 1124 S 19th St
- 1528 W Idaho Ave
- 1127 S 19th St
- 1512 W Iowa Ave
- 1628 W Chickasha Ave
- 1316 W Dakota Ave
- 1310 W Minnesota Ave
- 1401 W Chickasha Ave
- 628 S 12th St
- 804 S 12th St
- 828 S 12th St
- 2203 W Georgia Ave
- 1624 S 20th St
- 2830 W Georgia Ave
- 4 Cottonwood Dr
- 1624 S 19th St
- 2125 W Dakota Ave
- 2111 W Dakota Ave
- 2105 W Dakota Ave
- 2114 W Idaho Ave
- 2128 W Idaho Ave
- 2128 W Dakota Ave
- 2101 W Dakota Ave
- 2108 W Dakota Ave
- 628 S 21st St
- 2102 W Dakota Ave
- 516 S 21st St
- 602 S 22nd St
- 2027 W Dakota Ave
- 515 S 22nd St
- 2028 W Idaho Ave
- 2025 W Dakota Ave
- 2028 W Dakota Ave
- 514 S 21st St
- 517 S 21st St
- 702 S 21st St