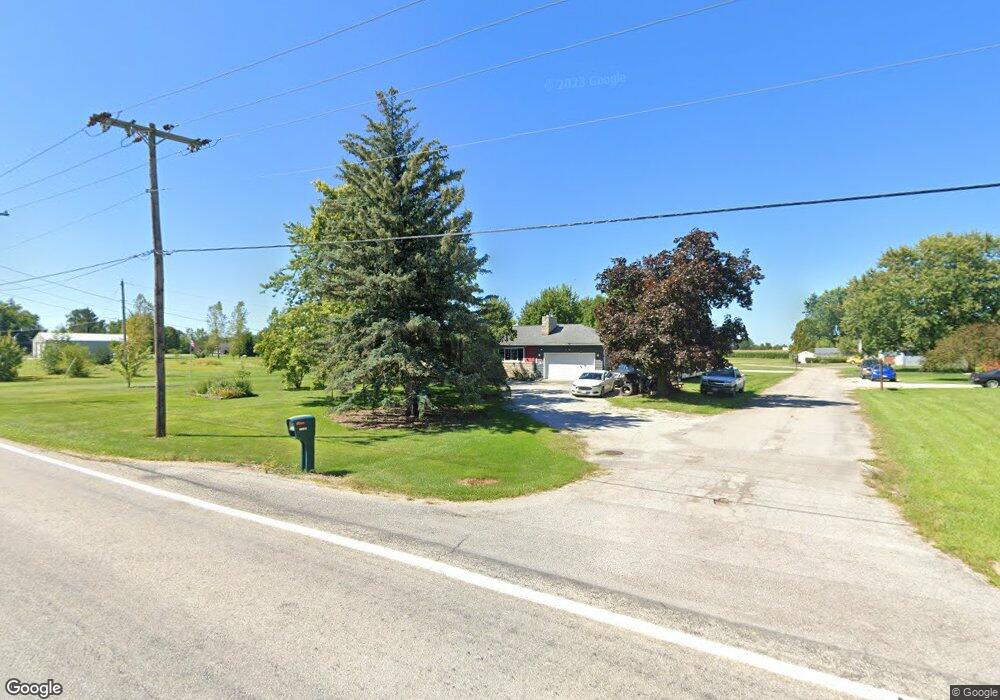
2127 Whetstone River Rd N Caledonia, OH 43314
Estimated Value: $164,000 - $216,000
3
Beds
2
Baths
1,560
Sq Ft
$117/Sq Ft
Est. Value
About This Home
This home is located at 2127 Whetstone River Rd N, Caledonia, OH 43314 and is currently estimated at $182,344, approximately $116 per square foot. 2127 Whetstone River Rd N is a home located in Marion County with nearby schools including River Valley High School.
Ownership History
Date
Name
Owned For
Owner Type
Purchase Details
Closed on
Oct 31, 2008
Sold by
Barnhart Melinda S and Barnhart Mindy S
Bought by
Dutt Terrance R
Current Estimated Value
Home Financials for this Owner
Home Financials are based on the most recent Mortgage that was taken out on this home.
Original Mortgage
$71,200
Interest Rate
5.73%
Mortgage Type
New Conventional
Purchase Details
Closed on
Jul 1, 2008
Sold by
Barnhart Line Wade
Bought by
Barnhart Melinda Sue
Purchase Details
Closed on
Sep 4, 2001
Bought by
Dutt Terrance R
Purchase Details
Closed on
Mar 22, 2000
Bought by
Dutt Terrance R
Purchase Details
Closed on
Mar 2, 1999
Bought by
Dutt Terrance R
Purchase Details
Closed on
Jul 31, 1996
Bought by
Dutt Terrance R
Create a Home Valuation Report for This Property
The Home Valuation Report is an in-depth analysis detailing your home's value as well as a comparison with similar homes in the area
Home Values in the Area
Average Home Value in this Area
Purchase History
| Date | Buyer | Sale Price | Title Company |
|---|---|---|---|
| Dutt Terrance R | $89,000 | Chicago Title | |
| Barnhart Melinda Sue | -- | None Available | |
| Dutt Terrance R | $88,000 | -- | |
| Dutt Terrance R | -- | -- | |
| Dutt Terrance R | -- | -- | |
| Dutt Terrance R | -- | -- |
Source: Public Records
Mortgage History
| Date | Status | Borrower | Loan Amount |
|---|---|---|---|
| Previous Owner | Dutt Terrance R | $71,200 |
Source: Public Records
Tax History Compared to Growth
Tax History
| Year | Tax Paid | Tax Assessment Tax Assessment Total Assessment is a certain percentage of the fair market value that is determined by local assessors to be the total taxable value of land and additions on the property. | Land | Improvement |
|---|---|---|---|---|
| 2024 | $1,308 | $40,150 | $5,600 | $34,550 |
| 2023 | $1,308 | $40,150 | $5,600 | $34,550 |
| 2022 | $1,298 | $40,150 | $5,600 | $34,550 |
| 2021 | $1,087 | $33,190 | $4,870 | $28,320 |
| 2020 | $1,052 | $33,190 | $4,870 | $28,320 |
| 2019 | $1,050 | $33,190 | $4,870 | $28,320 |
| 2018 | $967 | $32,080 | $4,980 | $27,100 |
| 2017 | $951 | $32,080 | $4,980 | $27,100 |
| 2016 | $915 | $32,080 | $4,980 | $27,100 |
| 2015 | $891 | $30,990 | $4,450 | $26,540 |
| 2014 | $1,081 | $30,990 | $4,450 | $26,540 |
| 2012 | $880 | $29,670 | $4,180 | $25,490 |
Source: Public Records
Map
Nearby Homes
- 2127 Whetstone River Rd N
- 327 N High St
- 0 Township Road 65
- 5038 Linn-Hipsher Rd
- 2447 Columbus-Sandusky Rd N
- 8 S Caledonia-Ashley Rd
- 3947 Spicer Rd
- 4902 Columbus Sandusky Rd N
- 3795 Morral Kirkpatrick Rd E
- 4374 Marion Edison Rd
- 3005 Marion Mount Gilead Rd
- 0 Pole Lane Rd Unit 225023270
- 3299 Cardington Iberia Rd
- 3090 Schell Dr
- 2463 Capaldi Dr
- 645 Augusta Dr
- 627 Augusta Dr
- 732 Bay Hill Ct
- 727 Bay Hill Ct Unit 35
- 6400 County Road 9
- 5972 Caledonia
- 5986 Caledonia Ave N
- 2147 Whetstone River Rd N
- 6001 Section Line Rd
- 5991 Section Line Rd
- 5979 Section Line Rd
- 5969 Section Line Rd
- 5955 Section Line Rd
- 0 Ohio 309
- 2134 Ohio 309
- 1693 Ohio 309
- 9995 Harding Hwy E
- 9997 Harding Hwy E
- 0 Harding Hwy E
- 5941 Section Line Rd
- 5931 Section Line Rd
- 1635 Ohio 309
- 2220 S Water St
- 2031 Whetstone River Rd N
- 2653 Caledonia N