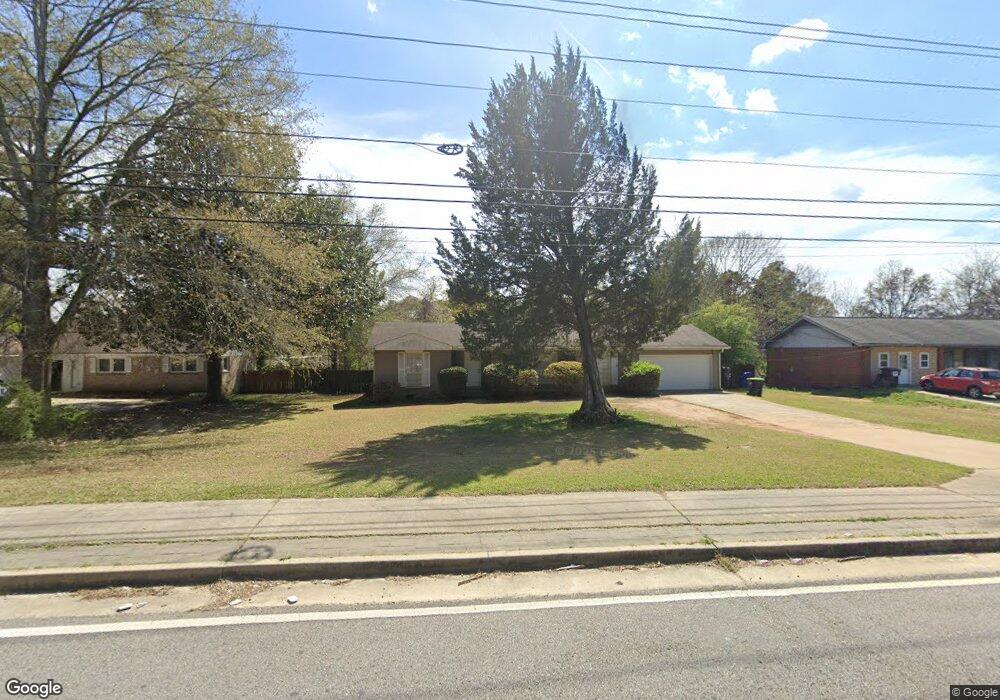
2128 Highway 138 E Unit 6 Jonesboro, GA 30236
Estimated Value: $210,000 - $251,000
3
Beds
2
Baths
1,401
Sq Ft
$168/Sq Ft
Est. Value
About This Home
This home is located at 2128 Highway 138 E Unit 6, Jonesboro, GA 30236 and is currently estimated at $234,797, approximately $167 per square foot. 2128 Highway 138 E Unit 6 is a home located in Clayton County with nearby schools including Arnold Elementary School, M. D. Roberts Middle School, and Jonesboro High School.
Ownership History
Date
Name
Owned For
Owner Type
Purchase Details
Closed on
Jun 8, 2017
Sold by
2015 3 Ih2 Borrower
Bought by
Project Promise Atlanta Llc
Current Estimated Value
Purchase Details
Closed on
Oct 5, 2016
Sold by
2015 3 Ih2 Borrower Lp
Bought by
2015 3 Ih2 Borrower Trust Llc
Purchase Details
Closed on
Jun 25, 2015
Sold by
Ih2 Property Georgia Lp
Bought by
2015 3 Ih2 Borrower Lp
Purchase Details
Closed on
Jun 3, 2013
Sold by
Double B Turnkey Investmen
Bought by
Ih2 Property Georgia Lp
Purchase Details
Closed on
Aug 7, 2012
Sold by
Trevillion Wilson E
Bought by
Double B Turnkey Investments L
Purchase Details
Closed on
Sep 7, 1999
Sold by
Market Street Mtg Corp
Bought by
Sec Of Va
Purchase Details
Closed on
Dec 6, 1994
Sold by
Stinson Leo and Wilkerson Nancy
Bought by
Fleet Finance
Create a Home Valuation Report for This Property
The Home Valuation Report is an in-depth analysis detailing your home's value as well as a comparison with similar homes in the area
Home Values in the Area
Average Home Value in this Area
Purchase History
| Date | Buyer | Sale Price | Title Company |
|---|---|---|---|
| Project Promise Atlanta Llc | $5,076,029 | -- | |
| 2015 3 Ih2 Borrower Trust Llc | -- | -- | |
| 2015 3 Ih2 Borrower Lp | -- | -- | |
| Ih2 Property Georgia Lp | $868,542 | -- | |
| Double B Turnkey Investments L | $21,000 | -- | |
| Sec Of Va | -- | -- | |
| Market Street Mtg Corp | $73,245 | -- | |
| Fleet Finance | $29,900 | -- |
Source: Public Records
Tax History Compared to Growth
Tax History
| Year | Tax Paid | Tax Assessment Tax Assessment Total Assessment is a certain percentage of the fair market value that is determined by local assessors to be the total taxable value of land and additions on the property. | Land | Improvement |
|---|---|---|---|---|
| 2024 | $3,527 | $90,400 | $8,000 | $82,400 |
| 2023 | $3,264 | $90,400 | $8,000 | $82,400 |
| 2022 | $2,337 | $59,560 | $8,000 | $51,560 |
| 2021 | $1,517 | $38,400 | $8,000 | $30,400 |
| 2020 | $1,536 | $38,400 | $8,000 | $30,400 |
| 2019 | $1,331 | $32,792 | $7,200 | $25,592 |
| 2018 | $1,330 | $32,756 | $7,200 | $25,556 |
| 2017 | $1,385 | $34,039 | $7,200 | $26,839 |
| 2016 | $1,385 | $34,039 | $7,200 | $26,839 |
| 2015 | $1,374 | $0 | $0 | $0 |
| 2014 | $1,342 | $33,746 | $7,200 | $26,546 |
Source: Public Records
Map
Nearby Homes
- 2140 Indian Hill Rd
- 7942 Rand Rd
- 0 Highway 138 E Unit 10460006
- 0 Highway 138 E Unit 10650191
- 0 Highway 138 E Unit 10638505
- 7940 Rand Rd
- 7972 Woods Ln Unit IX
- 1904 Cades Cove
- 8228 Lullwater Ct
- 2238 Danver Ct
- 2115 Logan Dr
- 1837 Coventry Way
- 1914 Lullwater Cir Unit V
- 8327 Commanche Ct
- 1753 Brenda Dr
- 1732 Winding Woods Ln
- 1938 Wrights Way
- 7583 Sunstone Dr
- 1699 Brenda Dr Unit 2
- 7621 Raleigh Ln
- 2128 Stockbridge Rd
- 2120 Highway 138 E
- 2136 Highway 138 E Unit 4
- 2136 Highway 138 E
- 2112 Gale Dr
- 2124 Gale Dr
- 2144 Highway 138 E
- 2112 Georgia 138
- 2112 Highway 138 E
- 2104 Gale Dr
- 2132 Gale Dr
- 2152 Highway 138 E
- 2144 Gale Dr
- 0 Gale Dr Unit 7013661
- 0 Gale Dr Unit 7225707
- 0 Gale Dr
- 2115 Gale Dr
- 2105 Gale Dr
- 2152 Gale Dr
- 8007 Sonja Dr