Estimated Value: $404,000 - $447,000
4
Beds
2
Baths
2,114
Sq Ft
$201/Sq Ft
Est. Value
About This Home
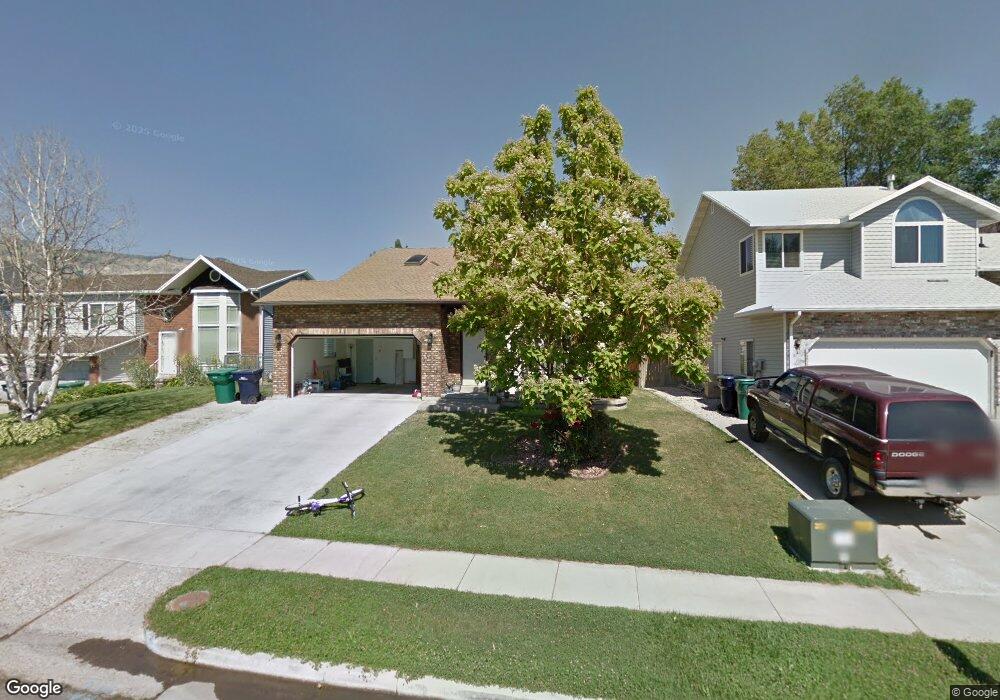
This home is located at 2128 N 600 W, Ogden, UT 84414 and is currently estimated at $424,413, approximately $200 per square foot. 2128 N 600 W is a home located in Weber County with nearby schools including Majestic Elementary School, Orion Junior High School, and Weber High School.
Ownership History
Date
Name
Owned For
Owner Type
Purchase Details
Closed on
Oct 30, 2017
Sold by
Rasmussen Jennifer
Bought by
Rasmussen Jennifer N
Current Estimated Value
Home Financials for this Owner
Home Financials are based on the most recent Mortgage that was taken out on this home.
Original Mortgage
$190,272
Outstanding Balance
$158,591
Interest Rate
3.83%
Mortgage Type
FHA
Estimated Equity
$265,822
Purchase Details
Closed on
Apr 13, 2010
Sold by
Williams R Brian
Bought by
Rasmussen Jennifer
Purchase Details
Closed on
Mar 29, 2002
Sold by
Cooper Todd D
Bought by
Williams R Brian and Williams Tami
Home Financials for this Owner
Home Financials are based on the most recent Mortgage that was taken out on this home.
Original Mortgage
$128,042
Interest Rate
6.84%
Mortgage Type
FHA
Create a Home Valuation Report for This Property
The Home Valuation Report is an in-depth analysis detailing your home's value as well as a comparison with similar homes in the area
Home Values in the Area
Average Home Value in this Area
Purchase History
| Date | Buyer | Sale Price | Title Company |
|---|---|---|---|
| Rasmussen Jennifer N | -- | Title Guarantee | |
| Rasmussen Jennifer | -- | United Title Services | |
| Williams R Brian | -- | Associated Title |
Source: Public Records
Mortgage History
| Date | Status | Borrower | Loan Amount |
|---|---|---|---|
| Open | Rasmussen Jennifer N | $190,272 | |
| Previous Owner | Williams R Brian | $128,042 | |
| Closed | Williams R Brian | $4,837 |
Source: Public Records
Tax History Compared to Growth
Tax History
| Year | Tax Paid | Tax Assessment Tax Assessment Total Assessment is a certain percentage of the fair market value that is determined by local assessors to be the total taxable value of land and additions on the property. | Land | Improvement |
|---|---|---|---|---|
| 2025 | $2,759 | $397,775 | $120,012 | $277,763 |
| 2024 | $2,728 | $215,049 | $66,006 | $149,043 |
| 2023 | $2,646 | $211,200 | $65,999 | $145,201 |
| 2022 | $2,554 | $208,450 | $63,250 | $145,200 |
| 2021 | $2,009 | $297,000 | $64,997 | $232,003 |
| 2020 | $1,826 | $248,000 | $49,962 | $198,038 |
| 2019 | $1,824 | $235,000 | $39,909 | $195,091 |
| 2018 | $1,829 | $226,000 | $39,909 | $186,091 |
| 2017 | $1,595 | $183,000 | $37,002 | $145,998 |
| 2016 | $1,520 | $94,126 | $16,811 | $77,315 |
| 2015 | $1,325 | $79,928 | $16,811 | $63,117 |
| 2014 | $1,277 | $75,202 | $16,811 | $58,391 |
Source: Public Records
Map
Nearby Homes
- 2205 N 700 W
- 416 W 1925 N
- 1272 N 350 W Unit 158
- 2303 N 300 W
- 1953 N 275 W Unit 13
- 2540 N 450 W
- 1964 N 225 W
- 2474 N Dorchester Ave
- 2491 N Highway 89 Unit 314
- 2491 N Highway 89 Unit 427
- 2491 N Highway 89 Unit 302
- 2491 N Highway 89 Unit 323
- 2491 N Highway 89 Unit 125
- 1743 N 400 W
- 2517 N Dorchester Ave
- 157 Arlington Way
- 615 Fox Meadow Dr
- 759 W Fox Meadow Dr
- 176 Savannah Ln
- 2393 Wellington Dr