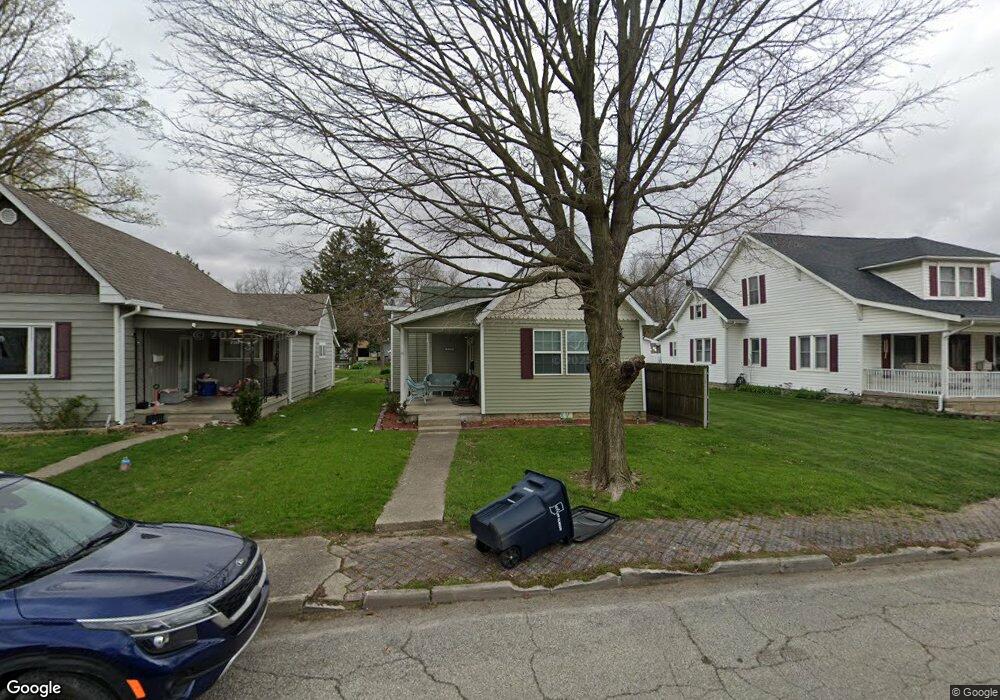
2128 N A St Elwood, IN 46036
Estimated Value: $115,000 - $136,000
2
Beds
1
Bath
992
Sq Ft
$121/Sq Ft
Est. Value
About This Home
This home is located at 2128 N A St, Elwood, IN 46036 and is currently estimated at $120,482, approximately $121 per square foot. 2128 N A St is a home located in Madison County with nearby schools including Elwood Elementary School, Elwood Intermediate School, and Elwood Junior-Senior High School.
Ownership History
Date
Name
Owned For
Owner Type
Purchase Details
Closed on
Dec 4, 2019
Sold by
Starcher Jeffrey Ray
Bought by
Parker Alona F
Current Estimated Value
Home Financials for this Owner
Home Financials are based on the most recent Mortgage that was taken out on this home.
Original Mortgage
$47,000
Outstanding Balance
$41,294
Interest Rate
3.75%
Mortgage Type
New Conventional
Estimated Equity
$79,188
Purchase Details
Closed on
Sep 13, 2011
Sold by
Cress David G
Bought by
Starcher Jefery Ray
Create a Home Valuation Report for This Property
The Home Valuation Report is an in-depth analysis detailing your home's value as well as a comparison with similar homes in the area
Home Values in the Area
Average Home Value in this Area
Purchase History
| Date | Buyer | Sale Price | Title Company |
|---|---|---|---|
| Parker Alona F | -- | Rowland Title | |
| Starcher Jefery Ray | -- | None Available |
Source: Public Records
Mortgage History
| Date | Status | Borrower | Loan Amount |
|---|---|---|---|
| Open | Parker Alona F | $47,000 |
Source: Public Records
Tax History Compared to Growth
Tax History
| Year | Tax Paid | Tax Assessment Tax Assessment Total Assessment is a certain percentage of the fair market value that is determined by local assessors to be the total taxable value of land and additions on the property. | Land | Improvement |
|---|---|---|---|---|
| 2025 | $568 | $56,800 | $6,200 | $50,600 |
| 2024 | $568 | $56,800 | $6,200 | $50,600 |
| 2023 | $517 | $51,700 | $5,900 | $45,800 |
| 2022 | $490 | $51,300 | $5,500 | $45,800 |
| 2021 | $429 | $46,000 | $5,400 | $40,600 |
| 2020 | $234 | $29,600 | $5,000 | $24,600 |
| 2019 | $178 | $28,900 | $5,000 | $23,900 |
| 2018 | $449 | $27,400 | $5,000 | $22,400 |
| 2017 | $546 | $27,300 | $5,000 | $22,300 |
| 2016 | $1,232 | $42,400 | $4,900 | $37,500 |
| 2014 | $872 | $43,600 | $5,000 | $38,600 |
| 2013 | $872 | $43,600 | $5,000 | $38,600 |
Source: Public Records
Map
Nearby Homes