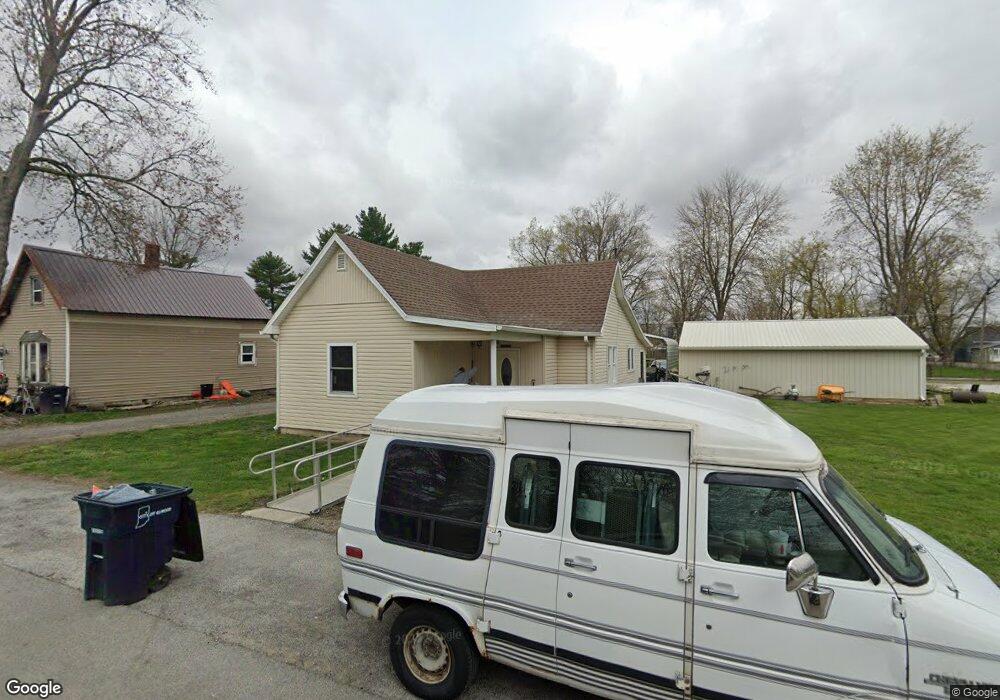
2128 N E St Elwood, IN 46036
Estimated Value: $112,268 - $156,000
3
Beds
--
Bath
1,332
Sq Ft
$103/Sq Ft
Est. Value
About This Home
This home is located at 2128 N E St, Elwood, IN 46036 and is currently estimated at $136,817, approximately $102 per square foot. 2128 N E St is a home located in Madison County with nearby schools including Elwood Elementary School, Elwood Intermediate School, and Elwood Junior-Senior High School.
Ownership History
Date
Name
Owned For
Owner Type
Purchase Details
Closed on
Mar 16, 2021
Sold by
Montgomery Charles M
Bought by
Montgomery Christian M
Current Estimated Value
Purchase Details
Closed on
Jun 5, 2019
Sold by
Gertrude Everling Estate
Bought by
Montgomery Charles M
Purchase Details
Closed on
May 6, 2014
Sold by
Everling Timothy J
Bought by
Everling Gertrude
Purchase Details
Closed on
Aug 13, 2009
Sold by
Forum Credit Union
Bought by
Everling Timothy J
Purchase Details
Closed on
May 15, 2009
Sold by
Waymire Jarrell B and Waymire Elizabeth S
Bought by
Forum Credit Union Of Indianapolis
Create a Home Valuation Report for This Property
The Home Valuation Report is an in-depth analysis detailing your home's value as well as a comparison with similar homes in the area
Home Values in the Area
Average Home Value in this Area
Purchase History
| Date | Buyer | Sale Price | Title Company |
|---|---|---|---|
| Montgomery Christian M | -- | None Available | |
| Montgomery Charles M | -- | None Available | |
| Everling Gertrude | -- | -- | |
| Everling Timothy J | -- | -- | |
| Forum Credit Union Of Indianapolis | $36,000 | -- |
Source: Public Records
Tax History Compared to Growth
Tax History
| Year | Tax Paid | Tax Assessment Tax Assessment Total Assessment is a certain percentage of the fair market value that is determined by local assessors to be the total taxable value of land and additions on the property. | Land | Improvement |
|---|---|---|---|---|
| 2025 | $1,106 | $55,300 | $8,100 | $47,200 |
| 2024 | $1,106 | $55,300 | $8,100 | $47,200 |
| 2023 | $1,010 | $50,500 | $7,700 | $42,800 |
| 2022 | $1,010 | $50,000 | $7,200 | $42,800 |
| 2021 | $898 | $44,900 | $7,000 | $37,900 |
| 2020 | $838 | $41,400 | $6,500 | $34,900 |
| 2019 | $824 | $40,700 | $6,500 | $34,200 |
| 2018 | $1,603 | $38,700 | $6,500 | $32,200 |
| 2017 | $766 | $38,300 | $6,500 | $31,800 |
| 2016 | $1,576 | $36,300 | $6,300 | $30,000 |
| 2014 | $745 | $37,200 | $6,500 | $30,700 |
| 2013 | $745 | $37,200 | $6,500 | $30,700 |
Source: Public Records
Map
Nearby Homes