Estimated Value: $414,000 - $541,000
5
Beds
3
Baths
3,136
Sq Ft
$145/Sq Ft
Est. Value
About This Home
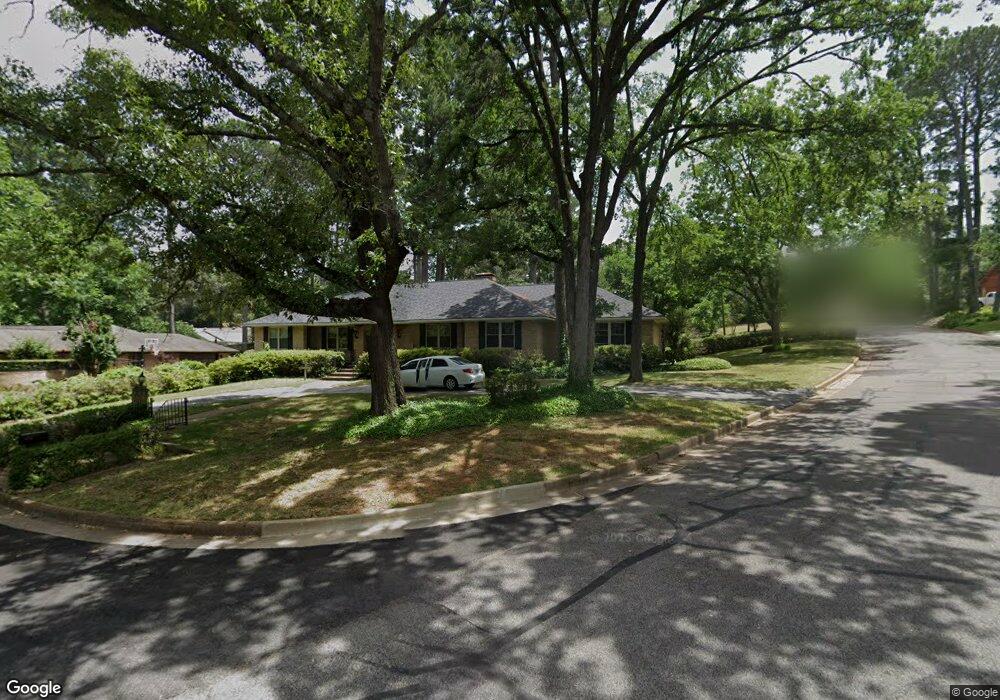
This home is located at 2128 Parkway Place, Tyler, TX 75701 and is currently estimated at $455,592, approximately $145 per square foot. 2128 Parkway Place is a home located in Smith County with nearby schools including Bell Elementary School, Hubbard Middle School, and Tyler Legacy High School.
Ownership History
Date
Name
Owned For
Owner Type
Purchase Details
Closed on
May 4, 2018
Sold by
Hutchinson Kerrie J and Hutchinson Karrie
Bought by
Hutchinson Kerrie and Hutchinson Kelly
Current Estimated Value
Home Financials for this Owner
Home Financials are based on the most recent Mortgage that was taken out on this home.
Original Mortgage
$126,400
Outstanding Balance
$108,468
Interest Rate
4.44%
Mortgage Type
Stand Alone First
Estimated Equity
$347,124
Purchase Details
Closed on
Sep 27, 2016
Sold by
Sisson Alta B
Bought by
Hutchinson Kerrie J
Purchase Details
Closed on
Sep 26, 2016
Sold by
Sisson Alta B and Hutchinson Kerrie J
Bought by
Sisson Lata B
Purchase Details
Closed on
Sep 26, 2011
Sold by
Haase Phyllis Black
Bought by
The Ralph E & Alta B Sisson Revocable Li
Home Financials for this Owner
Home Financials are based on the most recent Mortgage that was taken out on this home.
Original Mortgage
$187,000
Interest Rate
4.24%
Mortgage Type
Purchase Money Mortgage
Create a Home Valuation Report for This Property
The Home Valuation Report is an in-depth analysis detailing your home's value as well as a comparison with similar homes in the area
Home Values in the Area
Average Home Value in this Area
Purchase History
| Date | Buyer | Sale Price | Title Company |
|---|---|---|---|
| Hutchinson Kerrie | -- | Service Link | |
| Hutchinson Kerrie J | -- | None Available | |
| Sisson Lata B | -- | None Available | |
| The Ralph E & Alta B Sisson Revocable Li | -- | None Available |
Source: Public Records
Mortgage History
| Date | Status | Borrower | Loan Amount |
|---|---|---|---|
| Open | Hutchinson Kerrie | $126,400 | |
| Previous Owner | The Ralph E & Alta B Sisson Revocable Li | $187,000 |
Source: Public Records
Tax History Compared to Growth
Tax History
| Year | Tax Paid | Tax Assessment Tax Assessment Total Assessment is a certain percentage of the fair market value that is determined by local assessors to be the total taxable value of land and additions on the property. | Land | Improvement |
|---|---|---|---|---|
| 2025 | $4,985 | $447,956 | $108,852 | $339,104 |
| 2024 | $4,985 | $352,210 | $39,060 | $366,540 |
| 2023 | $5,582 | $366,803 | $39,060 | $327,743 |
| 2022 | $5,703 | $293,228 | $39,060 | $254,168 |
| 2021 | $5,552 | $264,621 | $33,852 | $230,769 |
| 2020 | $5,325 | $248,841 | $33,852 | $214,989 |
| 2019 | $5,067 | $231,737 | $28,644 | $203,093 |
| 2018 | $4,796 | $220,517 | $26,040 | $194,477 |
| 2017 | $4,866 | $227,902 | $26,040 | $201,862 |
| 2016 | $4,502 | $210,861 | $26,040 | $184,821 |
| 2015 | $1,918 | $198,095 | $26,040 | $172,055 |
| 2014 | $1,918 | $196,611 | $26,040 | $170,571 |
Source: Public Records
Map
Nearby Homes
- 2010 McDonald Rd
- 1929 Oakhurst Cir
- 2126 McDonald Rd
- 2006 McDonald Rd
- 1931 Sterling Dr
- 2320 Sarasota Dr
- 2026 Neeley St
- 2716 Royal Village Way
- The Dawson Plan at New Home Living at Medina
- 2949 Medina Dr
- The Hubbard Plan at New Home Living at Medina
- 2002 E Faulkner St
- 2014 Miller Dr
- 2331 Hunter St
- 2515 Preston Ave
- 1520 Clubview Dr
- 1715 Ridgeview Dr
- 2509 Delmar Dr
- 2408 Hunter St
- 2226 Mimosa Dr
- 2126 Parkway Place
- 2100 2100 Parkway Place
- 2015 2015 Parkway Place
- 2100 Parkway Place
- 2102 Parkway Place
- 2102 2102 Parkway Place
- 2315 Bernice Ave
- 2015 Parkway Place
- 2014 Lamplight Ln
- 2122 2122 Parkway Place
- 2125 Parkway Place
- 2104 Parkway Place
- 2020 Parkway Place
- 2011 Parkway Place
- 1929 1929 Oakhurst Cir
- 2014 Parkway Place
- 2014 2014 Parkway Place
- 2008 Lamplight Ln
- 2013 2013 Lamplight Ln
- 2013 Lamplight Ln