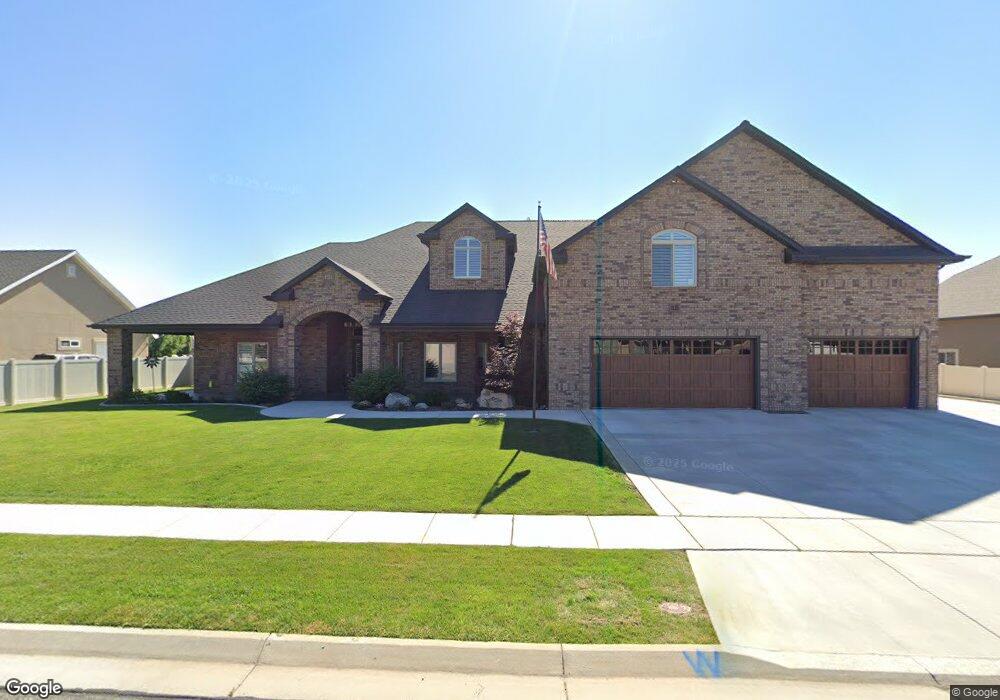
2128 S Davis Ln West Haven, UT 84401
Estimated Value: $1,163,000 - $1,642,147
2
Beds
3
Baths
7,223
Sq Ft
$181/Sq Ft
Est. Value
About This Home
This home is located at 2128 S Davis Ln, West Haven, UT 84401 and is currently estimated at $1,309,537, approximately $181 per square foot. 2128 S Davis Ln is a home located in Weber County with nearby schools including Kanesville Elementary School, Fremont High School, and Deamude Adventist Christian School.
Ownership History
Date
Name
Owned For
Owner Type
Purchase Details
Closed on
May 21, 2021
Sold by
Coates Scott A and Coates Leslee
Bought by
Coates Scott A and Coates Leslee
Current Estimated Value
Purchase Details
Closed on
Aug 27, 2008
Sold by
Jmr Development Llc
Bought by
Vlaardingerbroek Austin
Home Financials for this Owner
Home Financials are based on the most recent Mortgage that was taken out on this home.
Original Mortgage
$71,200
Interest Rate
6.27%
Mortgage Type
Balloon
Purchase Details
Closed on
Aug 27, 2007
Sold by
Secrist Acres Development Inc
Bought by
Jmr Development Llc
Home Financials for this Owner
Home Financials are based on the most recent Mortgage that was taken out on this home.
Original Mortgage
$1,771,493
Interest Rate
6.67%
Mortgage Type
Purchase Money Mortgage
Create a Home Valuation Report for This Property
The Home Valuation Report is an in-depth analysis detailing your home's value as well as a comparison with similar homes in the area
Home Values in the Area
Average Home Value in this Area
Purchase History
| Date | Buyer | Sale Price | Title Company |
|---|---|---|---|
| Coates Scott A | -- | None Available | |
| Vlaardingerbroek Austin | -- | Executive Title Ogden | |
| Jmr Development Llc | -- | Heritage West Title Ins |
Source: Public Records
Mortgage History
| Date | Status | Borrower | Loan Amount |
|---|---|---|---|
| Closed | Vlaardingerbroek Austin | $71,200 | |
| Previous Owner | Jmr Development Llc | $1,771,493 |
Source: Public Records
Tax History Compared to Growth
Tax History
| Year | Tax Paid | Tax Assessment Tax Assessment Total Assessment is a certain percentage of the fair market value that is determined by local assessors to be the total taxable value of land and additions on the property. | Land | Improvement |
|---|---|---|---|---|
| 2025 | $8,006 | $1,376,951 | $230,917 | $1,146,034 |
| 2024 | $7,655 | $741,948 | $127,004 | $614,944 |
| 2023 | $8,057 | $781,000 | $125,315 | $655,685 |
| 2022 | $8,294 | $826,100 | $114,269 | $711,831 |
| 2021 | $6,286 | $1,050,000 | $137,004 | $912,996 |
| 2020 | $6,060 | $928,000 | $101,461 | $826,539 |
| 2019 | $6,265 | $910,000 | $101,038 | $808,962 |
| 2018 | $6,487 | $908,000 | $90,829 | $817,171 |
| 2017 | $1,412 | $89,149 | $89,149 | $0 |
| 2016 | $1,283 | $80,549 | $80,549 | $0 |
| 2015 | $1,269 | $80,549 | $80,549 | $0 |
| 2014 | $1,089 | $65,728 | $65,728 | $0 |
Source: Public Records
Map
Nearby Homes
- 2954 W 2325 S
- 3672 3125 W Unit 12
- 3328 W 2100 S
- 2599 S 3075 W
- 2611 W 1850 S
- 1882 S 2475 W
- 2300 Farmhouse Select Plan at Fairhaven
- 1856 S 2425 W
- 1918 S 2475 W
- 1903 S 2425 W
- 1977 S 2425 W
- 2067 S 2425 W
- 2050 Farmhouse Select Plan at Fairhaven
- 1953 S 2425 W
- 1869 S 2425 W
- 1944 S 2425 W
- 3000 Farmhouse Select Plan at Fairhaven
- 2878 2850 S
- 2504 W 1725 S
- 2454 W 1775 S
- 2102 S Davis Ln
- 2158 S Davis Ln Unit 338
- 2147 S Davis Ln
- 3014 W 2175 S
- 2115 S Davis Ln
- 2151 S 2975 W
- 2151 S 2975 W Unit 50
- 2115 S Davis Ln Unit 312
- 2115 S Davis Ln
- 2147 S Davis Ln
- 2078 S Davis Ln
- 2093 S Davis Ln
- 2129 S 2975 W
- 2129 S 2975 W Unit 341
- 2171 S Davis Ln
- 3043 W Addison Way Unit 318
- 3023 W Addison Way
- 3023 W Addison Way Unit 319
- 3043 W Addison Way
- 3043 W Addison Way Unit 318