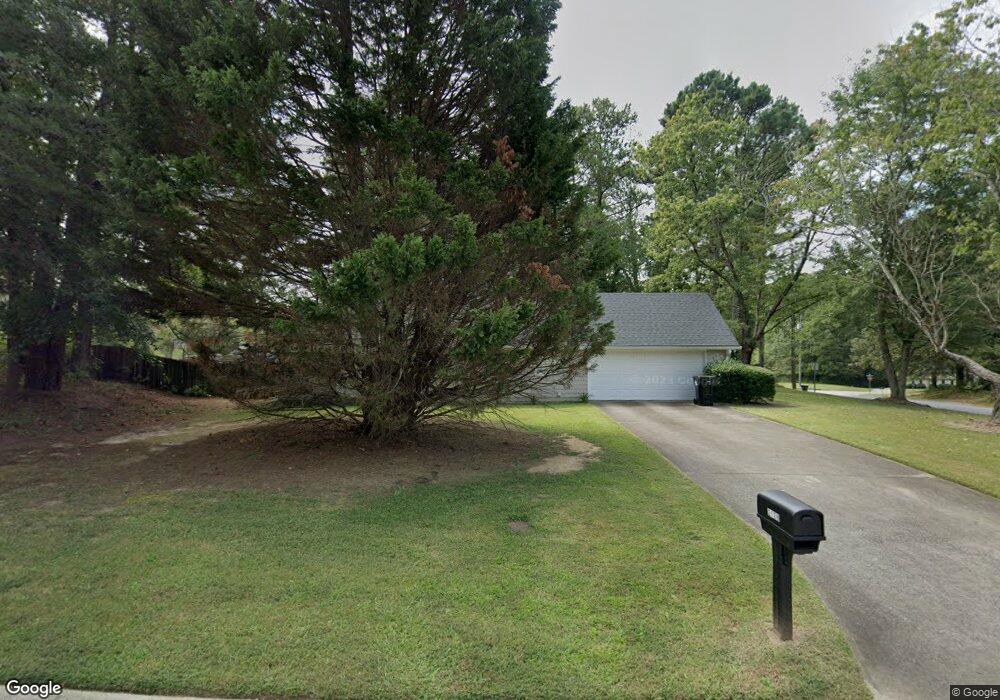
2128 Shay Ct Buford, GA 30519
Estimated Value: $328,000 - $373,568
3
Beds
2
Baths
1,616
Sq Ft
$220/Sq Ft
Est. Value
About This Home
This home is located at 2128 Shay Ct, Buford, GA 30519 and is currently estimated at $354,892, approximately $219 per square foot. 2128 Shay Ct is a home located in Gwinnett County with nearby schools including Duncan Creek Elementary School, Frank N. Osborne Middle School, and Mill Creek High School.
Ownership History
Date
Name
Owned For
Owner Type
Purchase Details
Closed on
Mar 8, 2011
Sold by
Hsbc Mtg Svcs Inc
Bought by
Petoskey Tiawanna C
Current Estimated Value
Home Financials for this Owner
Home Financials are based on the most recent Mortgage that was taken out on this home.
Original Mortgage
$90,142
Outstanding Balance
$63,528
Interest Rate
5.5%
Mortgage Type
FHA
Estimated Equity
$291,364
Purchase Details
Closed on
Jul 19, 2010
Sold by
Tucker Rex D and Tucker Judith A
Bought by
Hsbc Mtg Svcs
Purchase Details
Closed on
Apr 21, 2006
Sold by
Sachse Billy C
Bought by
Tucker Rex D and Tucker Judith A
Home Financials for this Owner
Home Financials are based on the most recent Mortgage that was taken out on this home.
Original Mortgage
$138,465
Interest Rate
8.29%
Mortgage Type
New Conventional
Purchase Details
Closed on
Jun 30, 2000
Sold by
Williford Susan M
Bought by
Sachse Billy C and Sachse Brandi N
Home Financials for this Owner
Home Financials are based on the most recent Mortgage that was taken out on this home.
Original Mortgage
$118,865
Interest Rate
8.63%
Mortgage Type
FHA
Create a Home Valuation Report for This Property
The Home Valuation Report is an in-depth analysis detailing your home's value as well as a comparison with similar homes in the area
Home Values in the Area
Average Home Value in this Area
Purchase History
| Date | Buyer | Sale Price | Title Company |
|---|---|---|---|
| Petoskey Tiawanna C | $92,500 | -- | |
| Hsbc Mtg Svcs | -- | -- | |
| Tucker Rex D | $162,900 | -- | |
| Sachse Billy C | $119,900 | -- |
Source: Public Records
Mortgage History
| Date | Status | Borrower | Loan Amount |
|---|---|---|---|
| Open | Petoskey Tiawanna C | $90,142 | |
| Previous Owner | Tucker Rex D | $138,465 | |
| Previous Owner | Sachse Billy C | $118,865 |
Source: Public Records
Tax History
| Year | Tax Paid | Tax Assessment Tax Assessment Total Assessment is a certain percentage of the fair market value that is determined by local assessors to be the total taxable value of land and additions on the property. | Land | Improvement |
|---|---|---|---|---|
| 2025 | $3,546 | $131,720 | $36,080 | $95,640 |
| 2024 | $3,640 | $129,680 | $30,000 | $99,680 |
| 2023 | $3,640 | $120,320 | $26,000 | $94,320 |
| 2022 | $3,117 | $106,280 | $26,000 | $80,280 |
| 2021 | $2,626 | $81,000 | $20,800 | $60,200 |
| 2020 | $2,553 | $76,840 | $18,720 | $58,120 |
| 2019 | $2,487 | $76,840 | $18,720 | $58,120 |
| 2018 | $2,305 | $68,480 | $15,920 | $52,560 |
| 2016 | $2,060 | $56,160 | $10,800 | $45,360 |
| 2015 | $2,076 | $56,160 | $10,800 | $45,360 |
| 2014 | $1,939 | $50,240 | $10,800 | $39,440 |
Source: Public Records
Map
Nearby Homes
- 2171 Spring Sound Ln
- 2201 Spring Sound Ln
- 2200 Spring Sound Ln
- 2118 Water Mill Ct
- 4602 Shay Terrace
- 2206 Spring Stone Ct
- 2238 Well Springs Dr
- 4457 Water Mill Dr
- 4657 Water Mill Dr NE
- 4317 Water Mill Dr
- 2979 Ogden Trail
- 4251 Haywater Cove
- 4742 Shay Terrace
- 2540 Wyndham Park Dr NE
- 4852 Jacobs Cove Point
- 4437 Waxwing St
- 4355 Magpie Dr
- 4335 Magpie Dr
- 2415 Hamilton Parc Ln
- 4335 Braselton Hwy Unit tax parcel R3003 327
- 4635 Brandon Acres Ln
- 2108 Shay Ct
- 2115 Brandon Acres Dr
- 2129 Shay Ct
- 2109 Shay Ct
- 2099 Shay Ct
- 2145 Brandon Acres Dr
- 4650 Brandon Acres Ln
- 2105 Brandon Acres Dr
- 2155 Brandon Acres Dr
- 4675 Brandon Acres Ln
- 2130 Brandon Acres Dr
- 2120 Brandon Acres Dr
- 4680 Brandon Acres Ln
- 2140 Brandon Acres Dr
- 2110 Brandon Acres Dr
- 4685 Brandon Acres Ln
- 2150 Brandon Acres Dr
- 2165 Brandon Acres Dr
- 4682 Spout Springs Rd
Your Personal Tour Guide
Ask me questions while you tour the home.