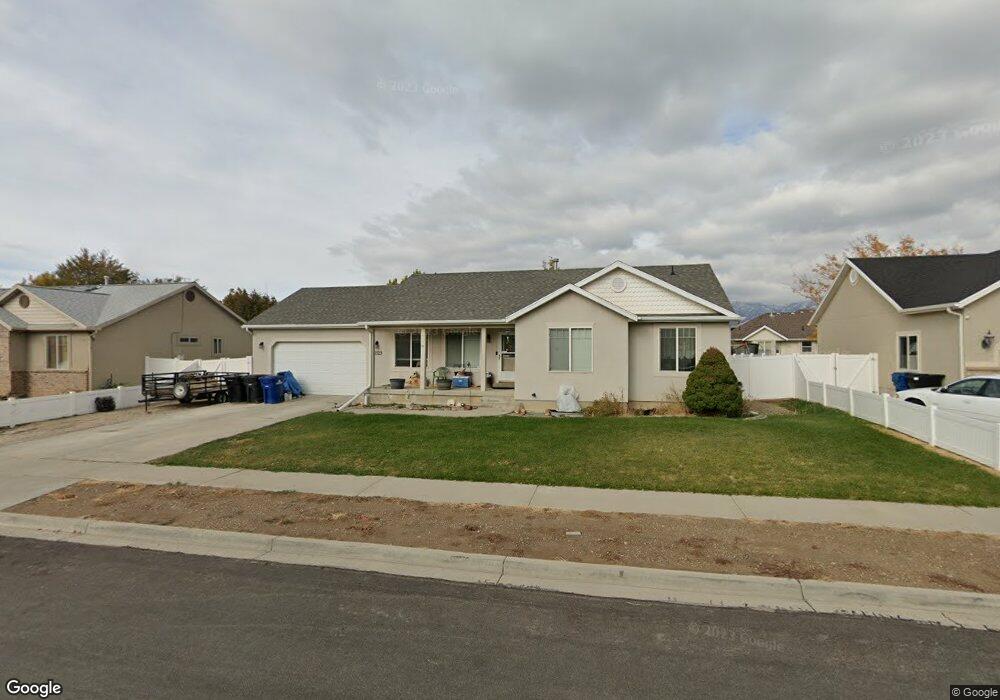
2129 E 1760 S Spanish Fork, UT 84660
Estimated Value: $513,035 - $528,000
3
Beds
2
Baths
1,298
Sq Ft
$402/Sq Ft
Est. Value
About This Home
This home is located at 2129 E 1760 S, Spanish Fork, UT 84660 and is currently estimated at $522,012, approximately $402 per square foot. 2129 E 1760 S is a home located in Utah County with nearby schools including East Meadows Elementary School, Spanish Fork Jr High School, and Spanish Fork High School.
Ownership History
Date
Name
Owned For
Owner Type
Purchase Details
Closed on
Mar 31, 2022
Sold by
Larsen Kevin G
Bought by
Larsen Kevin G and Larsen Jeanna
Current Estimated Value
Home Financials for this Owner
Home Financials are based on the most recent Mortgage that was taken out on this home.
Original Mortgage
$165,000
Outstanding Balance
$135,271
Interest Rate
3.83%
Mortgage Type
New Conventional
Estimated Equity
$386,741
Purchase Details
Closed on
Mar 1, 2002
Sold by
Custom Home Group Lc
Bought by
Larsen Kevin G and Larsen Eugenia S
Home Financials for this Owner
Home Financials are based on the most recent Mortgage that was taken out on this home.
Original Mortgage
$130,000
Interest Rate
6.8%
Purchase Details
Closed on
Jun 5, 2001
Sold by
Hearthstone Development Inc
Bought by
Custom Home Group Lc
Create a Home Valuation Report for This Property
The Home Valuation Report is an in-depth analysis detailing your home's value as well as a comparison with similar homes in the area
Home Values in the Area
Average Home Value in this Area
Purchase History
| Date | Buyer | Sale Price | Title Company |
|---|---|---|---|
| Larsen Kevin G | -- | Us Title | |
| Larsen Kevin G | -- | Mountain West Title Co | |
| Custom Home Group Lc | -- | Backman Stewart Title Servi |
Source: Public Records
Mortgage History
| Date | Status | Borrower | Loan Amount |
|---|---|---|---|
| Open | Larsen Kevin G | $165,000 | |
| Previous Owner | Larsen Kevin G | $130,000 |
Source: Public Records
Tax History
| Year | Tax Paid | Tax Assessment Tax Assessment Total Assessment is a certain percentage of the fair market value that is determined by local assessors to be the total taxable value of land and additions on the property. | Land | Improvement |
|---|---|---|---|---|
| 2025 | $2,343 | $261,525 | -- | -- |
| 2024 | $2,343 | $241,505 | $0 | $0 |
| 2023 | $2,382 | $245,795 | $0 | $0 |
| 2022 | $2,487 | $251,735 | $0 | $0 |
| 2021 | $2,056 | $332,800 | $115,800 | $217,000 |
| 2020 | $1,945 | $306,200 | $105,300 | $200,900 |
| 2019 | $1,764 | $292,100 | $91,200 | $200,900 |
| 2018 | $1,640 | $262,500 | $87,700 | $174,800 |
| 2017 | $1,526 | $131,285 | $0 | $0 |
| 2016 | $1,411 | $119,790 | $0 | $0 |
| 2015 | $1,308 | $109,725 | $0 | $0 |
| 2014 | $1,181 | $99,440 | $0 | $0 |
Source: Public Records
Map
Nearby Homes
- 1503 S 3740 E Unit 1320
- 1547 S 2120 E
- 2376 E 1610 S
- 1907 E 1960 S
- 417 E 1460 S Unit 48
- 2237 E 1400 S
- 82 E 1900 S Unit 10
- 357 E 1460 S Unit 45
- 385 E 1460 S Unit 47
- 2387 E Canyon Crest Dr Unit 44
- 2662 E 1600 S
- 1528 E 1790 S
- 1878 E 1050 S
- 1147 S 1660 E
- 804 E 1610 S Unit 91
- 824 E 1610 S Unit 92
- 2968 E Canyon Meadows Dr
- 1687 E 1000 S
- 993 S 1660 E
- 2342 E 830 S Unit 26
Your Personal Tour Guide
Ask me questions while you tour the home.