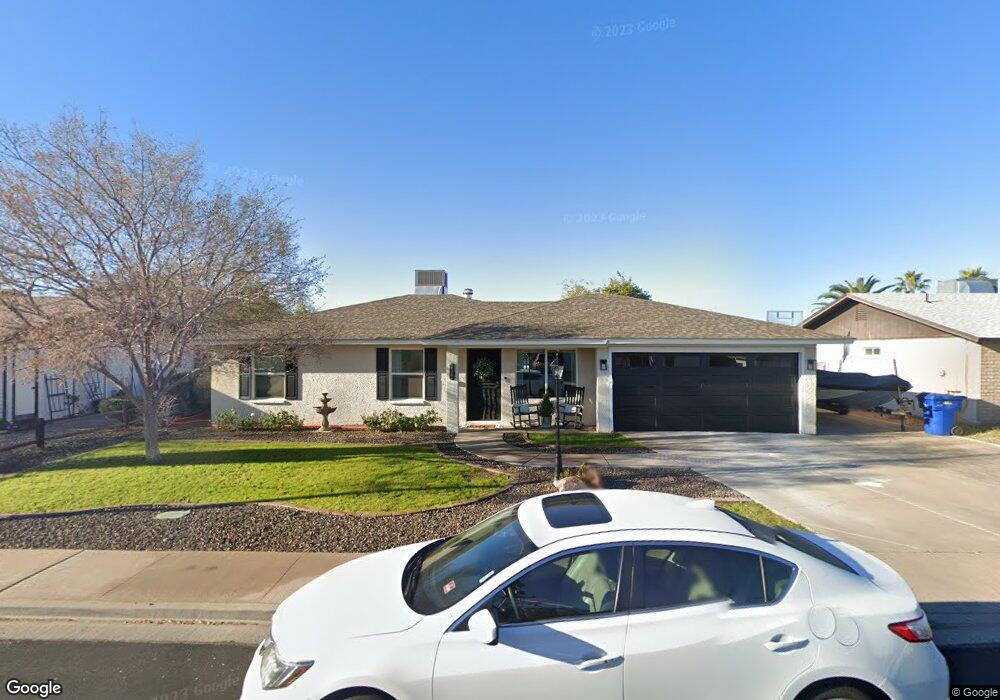
2129 E Dolphin Ave Mesa, AZ 85204
Central Mesa NeighborhoodEstimated Value: $389,442 - $479,000
Studio
2
Baths
1,780
Sq Ft
$247/Sq Ft
Est. Value
About This Home
This home is located at 2129 E Dolphin Ave, Mesa, AZ 85204 and is currently estimated at $439,361, approximately $246 per square foot. 2129 E Dolphin Ave is a home located in Maricopa County with nearby schools including Franklin at Brimhall Elementary School, Franklin West Elementary School, and Franklin Accelerated Academy Jordan Campus.
Ownership History
Date
Name
Owned For
Owner Type
Purchase Details
Closed on
May 14, 2020
Sold by
Forshee Robert and Forshee Leslie
Bought by
Forshee Robert and Forshee Lesile E
Current Estimated Value
Home Financials for this Owner
Home Financials are based on the most recent Mortgage that was taken out on this home.
Original Mortgage
$134,150
Outstanding Balance
$118,876
Interest Rate
3.3%
Mortgage Type
New Conventional
Estimated Equity
$320,485
Purchase Details
Closed on
Dec 10, 2003
Sold by
Forshee Bobby W
Bought by
Forshee Bobby W and Forshee Leslie E
Home Financials for this Owner
Home Financials are based on the most recent Mortgage that was taken out on this home.
Original Mortgage
$86,468
Interest Rate
6.03%
Mortgage Type
FHA
Purchase Details
Closed on
Jul 2, 1998
Sold by
Contreras Michael and Contreras Lidia V
Bought by
Forshee Robert W
Home Financials for this Owner
Home Financials are based on the most recent Mortgage that was taken out on this home.
Original Mortgage
$91,309
Interest Rate
6.9%
Mortgage Type
FHA
Create a Home Valuation Report for This Property
The Home Valuation Report is an in-depth analysis detailing your home's value as well as a comparison with similar homes in the area
Home Values in the Area
Average Home Value in this Area
Purchase History
| Date | Buyer | Sale Price | Title Company |
|---|---|---|---|
| Forshee Robert | -- | Driggs Title Agency Inc | |
| Forshee Bobby W | -- | First Southwestern Title | |
| Forshee Robert W | $94,000 | Capital Title Agency |
Source: Public Records
Mortgage History
| Date | Status | Borrower | Loan Amount |
|---|---|---|---|
| Open | Forshee Robert | $134,150 | |
| Closed | Forshee Bobby W | $86,468 | |
| Closed | Forshee Robert W | $91,309 |
Source: Public Records
Tax History
| Year | Tax Paid | Tax Assessment Tax Assessment Total Assessment is a certain percentage of the fair market value that is determined by local assessors to be the total taxable value of land and additions on the property. | Land | Improvement |
|---|---|---|---|---|
| 2025 | $1,398 | $16,838 | -- | -- |
| 2024 | $1,414 | $16,037 | -- | -- |
| 2023 | $1,414 | $32,580 | $6,510 | $26,070 |
| 2022 | $1,383 | $25,060 | $5,010 | $20,050 |
| 2021 | $1,420 | $22,880 | $4,570 | $18,310 |
| 2020 | $1,401 | $21,370 | $4,270 | $17,100 |
| 2019 | $1,298 | $19,380 | $3,870 | $15,510 |
| 2018 | $1,240 | $18,050 | $3,610 | $14,440 |
| 2017 | $1,201 | $16,420 | $3,280 | $13,140 |
| 2016 | $1,179 | $16,010 | $3,200 | $12,810 |
| 2015 | $1,113 | $15,350 | $3,070 | $12,280 |
Source: Public Records
Map
Nearby Homes
- 2036 E Marilyn Ave
- 2226 E Diamond Ave
- 1909 E 6th Ave
- 2148 E Emelita Ave
- 2210 E Edgewood Ave
- 2205 E El Moro Ave
- 1753 E Diamond Ave
- 2124 E 3rd Dr
- 2115 E Birchwood Ave
- 1832 E Enid Ave
- 714 S Williams
- 429 S Gaylord
- 2127 E Bayberry Ave
- 2219 E Fairview Ave
- 628 S 26th St
- 546 S 26th St
- 522 S 26th St
- 2352 E Florian Cir
- 335 S Harris Dr
- 2100 E Alpine Cir
- 2121 E Dolphin Ave
- 2137 E Dolphin Ave
- 2136 E Diamond Ave
- 2128 E Diamond Ave
- 2144 E Diamond Ave
- 2145 E Dolphin Ave
- 2113 E Dolphin Ave
- 2132 E Dolphin Ave
- 2120 E Diamond Ave
- 2124 E Dolphin Ave
- 2140 E Dolphin Ave
- 2152 E Diamond Ave
- 2116 E Dolphin Ave
- 2153 E Dolphin Ave
- 2112 E Diamond Ave
- 2105 E Dolphin Ave
- 2148 E Dolphin Ave
- 2061 E Marilyn Ave
- 2062 E 7th Ave
- 2133 E Dragoon Ave
Your Personal Tour Guide
Ask me questions while you tour the home.